








SPX 200-DMA, EUR/USD, GBP/USD Breakouts on USD Pullback
It’s been a fast start to the week with selloffs in both U.S. equities and the USD. But volatility continues to flow and tonight brings a State of the Union Speech from President Trump.
Share this:

EUR/USD, GBP/USD, US Dollar Talking Points:
- The US Dollar set a fresh 2025 low this morning and U.S. equities set a fresh low since the election in November. Tariff dynamics has many on the edge of their seats, and tonight’s State of the Union Address from President Trump can keep the volatility flowing.
- Tariffs are set to come into effect on Canada and Mexico today and already we’ve heard of retaliation from Canada. This can keep USD/CAD as one of the more attractive pairs for USD-strength until something changes on that front. And for USD-weakness, GBP/USD and EUR/USD both retain some attraction, as each has just pressed up to fresh 2025 highs.
- This is an archived webinar and you’re welcome to join the next. Click here for registration information.
It’s been a volatile past couple of days in the US Dollar as the second half of last week saw a strong bid in the Greenback. DXY negated an evening star formation on the monthly chart with it’s rally in the last few days of the month, but sellers were back with a vengeance this week and that’s allowed for them to press the Dollar down to a fresh 2025 low.
Unlike the inverse relationship that showed with equities two months ago, when the USD topped on January 13th as SPX finished off the election gap, this time both markets are being driven by sellers with stocks similarly setting a fresh 2025 low this morning. SPX has just tested the 200-day moving average for the first time since November of 2023, and this sets up for an interesting backdrop as tonight’s State of the Union Address from President Trump brings the opportunity for even more volatility.
I started off the webinar by looking at this setup, and already there’s been a bounce from that first 200-dma test in more than a year. Price is also finding a bit of support from the prior election gap, which led to a strong rally up to a fresh ATH after that was filled earlier in 2025 trade.
For bears, there’s resistance potential at the top of the gap from this morning’s open, running up to approximately 5850.
This aligns with what I had discussed in the 2025 Forecast for Equities, which you can access from the link below:
SPX Daily Chart
Chart prepared by James Stanley; data derived from Tradingview
US Dollar
The USD is driving on tariff drama and there’s also been the recent trend in US economic data, causing the Atlanta GDP Now estimate for Q1 to dip down to -2.8% in its most recent reading. I think that’s driving some fear of slowdown or possibly even recession in the US economy, and this is a likely reason why tariffs previously were a driver of USD-strength and, more recently, have been a factor of USD-weakness.
Prior support of 106.35 and 106.61 is now short-term resistance potential for DXY, and the next significant spot of support is down around the 105 handle.
US Dollar Weekly Price Chart
 Chart prepared by James Stanley; data derived from Tradingview
EUR/USD Breakout
I’ve been looking for a EUR/USD breakout as that 1.0500 level was seeing an increasing frequency of tests. Last week showed a strong pullback in the back-half of the week after another resistance hit at 1.0523; but this week is showing a far different tone and EUR/USD is now trading at a fresh 2025 high.
There’s a major resistance level overhead at 1.0611, which is the 38.2% Fibonacci retracement of both the 2021-2022 major move, and the 2022-2023 move. The 1.0200 level had a similar element of confluence and that’s so far held the lows for the year, after coming into play on January 13th when the USD had topped.
EUR/USD Eight-Hour Price Chart
 Chart prepared by James Stanley; data derived from Tradingview
GBP/USD Into Resistance
As I’ve been saying, I think GBP/USD has been a cleaner venue for USD-weakness scenarios and I wrote about the pair yesterday. GBP/USD has since rallied up to the next resistance zone, around the 1.2750 psychological level, and the pair retains a bullish trend. In the webinar, I looked at GBP/USD from a shorter-term perspective in effort of finding higher-low support levels.
GBP/USD Four-Hour Chart
 Chart prepared by James Stanley; data derived from Tradingview
USD/CAD
Given the ongoing tariff drama, I’m continuing to expect USD/CAD to be one of the more attractive major pairs for scenarios of USD-strength. The challenge at this point is the 1.4500 psychological level as that’s been a price that hasn’t seen much bullish activity above, save for the early-February breakout.
At this point, there’s shorter-term support potential down to the bottom of that zone, around 1.4467, and for next resistance, I’m tracking 1.4596 followed by the 1.4668-1.4690 zone.
USD/CAD Four-Hour Price Chart
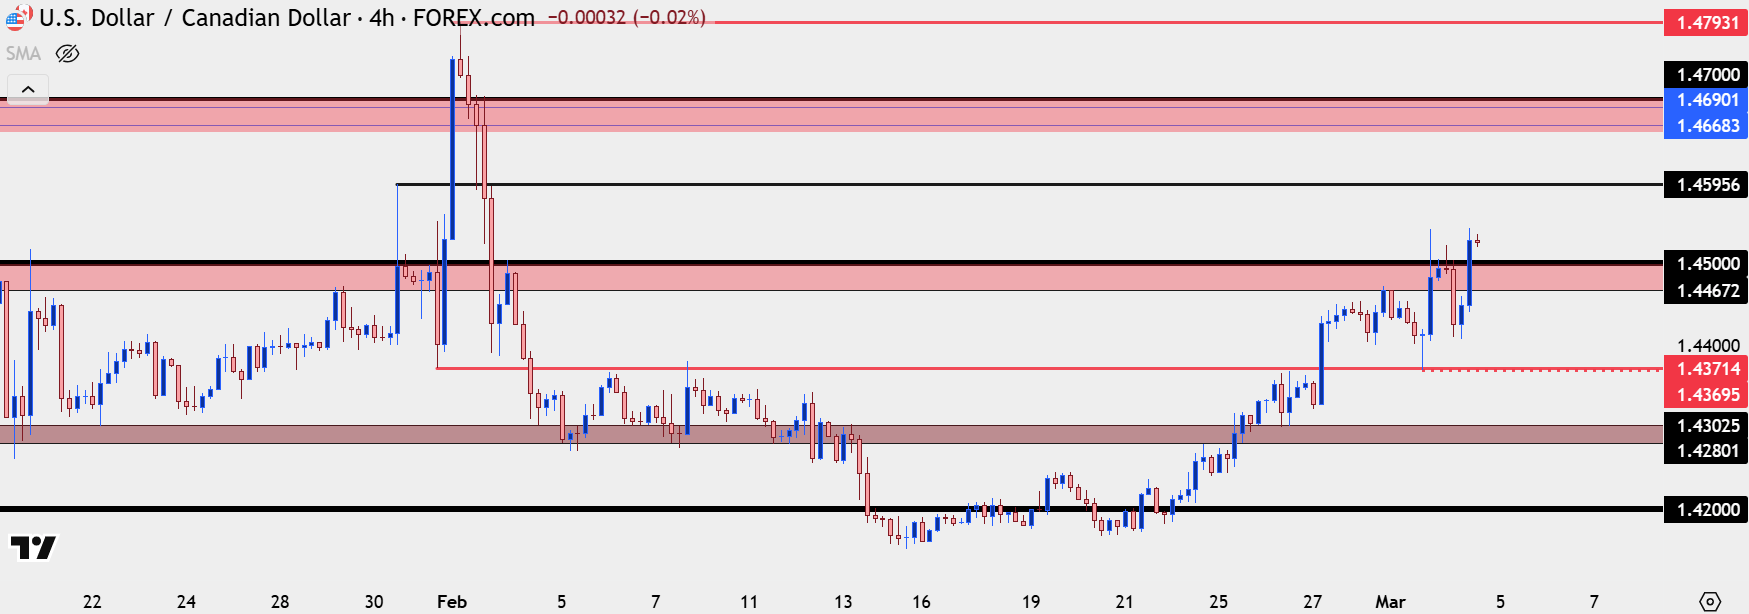 Chart prepared by James Stanley; data derived from Tradingview
--- written by James Stanley, Senior Strategist
EUR/USD, GBP/USD, US Dollar Talking Points:
- The US Dollar set a fresh 2025 low this morning and U.S. equities set a fresh low since the election in November. Tariff dynamics has many on the edge of their seats, and tonight’s State of the Union Address from President Trump can keep the volatility flowing.
- Tariffs are set to come into effect on Canada and Mexico today and already we’ve heard of retaliation from Canada. This can keep USD/CAD as one of the more attractive pairs for USD-strength until something changes on that front. And for USD-weakness, GBP/USD and EUR/USD both retain some attraction, as each has just pressed up to fresh 2025 highs.
It’s been a volatile past couple of days in the US Dollar as the second half of last week saw a strong bid in the Greenback. DXY negated an evening star formation on the monthly chart with it’s rally in the last few days of the month, but sellers were back with a vengeance this week and that’s allowed for them to press the Dollar down to a fresh 2025 low.
Unlike the inverse relationship that showed with equities two months ago, when the USD topped on January 13th as SPX finished off the election gap, this time both markets are being driven by sellers with stocks similarly setting a fresh 2025 low this morning. SPX has just tested the 200-day moving average for the first time since November of 2023, and this sets up for an interesting backdrop as tonight’s State of the Union Address from President Trump brings the opportunity for even more volatility.
I started off the webinar by looking at this setup, and already there’s been a bounce from that first 200-dma test in more than a year.
For bears, there’s resistance potential at the top of the gap from this morning’s open, running up to approximately 5850.
This aligns with what I had discussed in the 2025 Forecast for Equities, which you can access from the link below:
SPX Daily Chart
Chart prepared by James Stanley; data derived from Tradingview
US Dollar
The USD is driving on tariff drama and there’s also been the recent trend in US economic data, causing the Atlanta GDP Now estimate for Q1 to dip down to -2.8% in its most recent reading. I think that’s driving some fear of slowdown or possibly even recession in the US economy, and this is a likely reason why tariffs previously were a driver of USD-strength and, more recently, have been a factor of USD-weakness.
Prior support of 106.35 and 106.61 is now short-term resistance potential for DXY, and the next significant spot of support is down around the 105 handle.
US Dollar Weekly Price Chart
Chart prepared by James Stanley; data derived from Tradingview
EUR/USD Breakout
I’ve been looking for a EUR/USD breakout as that 1.0500 level was seeing an increasing frequency of tests. Last week showed a strong pullback in the back-half of the week after another resistance hit at 1.0523; but this week is showing a far different tone and EUR/USD is now trading at a fresh 2025 high.
There’s a major resistance level overhead at 1.0611, which is the 38.2% Fibonacci retracement of both the 2021-2022 major move, and the 2022-2023 move. The 1.0200 level had a similar element of confluence and that’s so far held the lows for the year, after coming into play on January 13th when the USD had topped.
EUR/USD Eight-Hour Price Chart
Chart prepared by James Stanley; data derived from Tradingview
GBP/USD Into Resistance
As I’ve been saying, I think GBP/USD has been a cleaner venue for USD-weakness scenarios and I wrote about the pair yesterday. GBP/USD has since rallied up to the next resistance zone, around the 1.2750 psychological level, and the pair retains a bullish trend. In the webinar, I looked at GBP/USD from a shorter-term perspective in effort of finding higher-low support levels.
GBP/USD Four-Hour Chart
Chart prepared by James Stanley; data derived from Tradingview
USD/CAD
Given the ongoing tariff drama, I’m continuing to expect USD/CAD to be one of the more attractive major pairs for scenarios of USD-strength. The challenge at this point is the 1.4500 psychological level as that’s been a price that hasn’t seen much bullish activity above, save for the early-February breakout.
At this point, there’s shorter-term support potential down to the bottom of that zone, around 1.4467, and for next resistance, I’m tracking 1.4596 followed by the 1.4668-1.4690 zone.
USD/CAD Four-Hour Price Chart
Chart prepared by James Stanley; data derived from Tradingview
--- written by James Stanley, Senior Strategist
Latest market news




Open an account in minutes
Experience award-winning platforms with fast and secure execution, and enjoy tight spreads from 0.5 pts on FX and 0.3 pts on indices.
Economic calendar
Web Trader platform
Our sophisticated web-based platform is packed with features.
Related articles

S&P 500 forecast: Stocks extend drop as correction risks grow
US and global equity markets have extended Wednesday’s sell-off, with Wall Street opening lower after a weak handover from Asia and Europe. The deterioration in risk appetite has been spreading across global markets. The dollar was firmer, Treasury yields were holding onto yesterday’s gains, while gold, silver and bitcoin were all under pressure alongside equities and major currencies.


Wall Street Forecast: DJIA falls as treasury yields hit new highs and ahead of the Trump-Xi summit
U.S. stocks are falling, further extending losses from the previous session, as oil prices move higher alongside Treasury yields and caution reigns ahead of the summit between President Trump and Xi Jinping.

GBP/USD, DJIA Outlook: Support Levels Meet Oversold Risks
GBP/USD and the Dow test key support levels as rising Treasury yields, Fed rate-hike expectations and oversold momentum increase reversal risks.

This report is intended for general circulation only. It should not be construed as a recommendation, or an offer (or solicitation of an offer) to buy or sell any financial products. The information provided does not take into account your specific investment objectives, financial situation or particular needs. Before you act on any recommendation that may be contained in this report, independent advice ought to be sought from a financial adviser regarding the suitability of the investment product, taking into account your specific investment objectives, financial situation or particular needs.
StoneX Financial Pte. Ltd., may distribute reports produced by its respective foreign entities or affiliates within the StoneX group of companies or third parties pursuant to an arrangement under Regulation 32C of the Financial Advisers Regulations. Where the report is distributed to a person in Singapore who is not an accredited investor, expert investor or an institutional investor (as defined in the Securities Futures Act), StoneX Financial Pte. Ltd. accepts legal responsibility to such persons for the contents of the report only to the extent required by law. Singapore recipients should contact StoneX Financial Pte. Ltd. at 6826 9988 for matters arising from, or in connection with the report.
In the case of all other recipients of this report, to the extent permitted by applicable laws and regulations neither StoneX Financial Pte. Ltd. nor its associated companies will be responsible or liable for any loss or damage incurred arising out of, or in connection with, any use of the information contained in this report and all such liability is hereby expressly disclaimed. No representation or warranty is made, express or implied, that the content of this report is complete or accurate.
StoneX Financial Pte. Ltd. is not under any obligation to update this report.
Trading CFDs carries a high level of risk that may not be suitable for some investors. Consider your investment objectives, level of experience, financial resources, risk appetite and other relevant circumstances carefully. The possibility exists that you could lose some or all of your investments, including your initial deposits. If in doubt, please seek independent expert advice. Visit www.forex.com/en-sg/terms-and-policies for the complete Risk Disclosure Statement.