






Stocks Continue to be Slammed VIX Breaks Out
The SP500 Index is down over 100 handles the past 2 days
Share this:

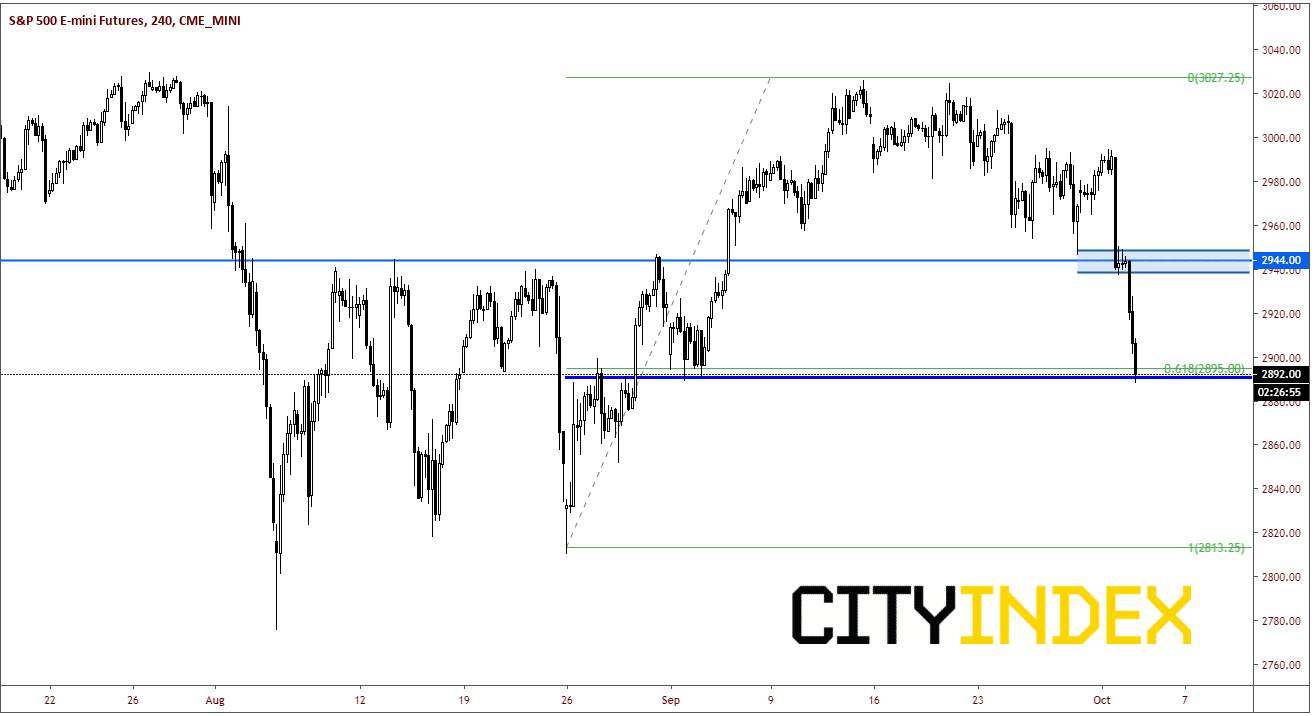
SP500 Futures continued its selloff that began yesterday after today’s worse than expected ADP Nonfarm Employment Change for September. Although the headline number was in line for the most part (135K vs 140K expected), it was the revision from August 195K down to 157K the made this data much worse than expected. This comes after yesterday’s worse than expected US ISM Manufacturing PMI for September. The index is down over 100 handles over the past 2 days near 2891. The daily chart shows SP500 Futures broke key support near 2944, which was strong horizontal resistance on the way up. Currently price is sitting at the 61.8% retracement from the August 26th lows to the September 13th highs. If price breaks lower from here, it looks possible to retrace all the way back down the 2813.
Source: Tradingview, City Index, CME
If we zoom in on a 240-minute chart, resistance doesn’t come into play until way above in the 2440/2450 zone.
Source: Tradingview, City Index, CME
As one would expect, the Volatility SP500 Index, better know as the VIX, has gapped higher today. The 240-minute chart shows the VIX broke out of a descending wedge is late September and came back to test the downward slowing trendline twice, before finally breaking higher today. Horizontal resistance comes in at 21.60. Above that is the August 5th highs at 24.80. First support is back at the gap at 18.60. (note that the RSI is moving into overbought territory, so we may see a pullback shortly, or at least a sideways move so the RSI indicator can move back within the neutral range).
Source: Tradingview, City Index
The next catalyst seems like it can come from anywhere at this point. The political is very contentious within the US, Brexit discussions are ongoing, and on Friday, the US Nonfarm Payrolls data is released. Once again, be on alert for headlines and tweets!
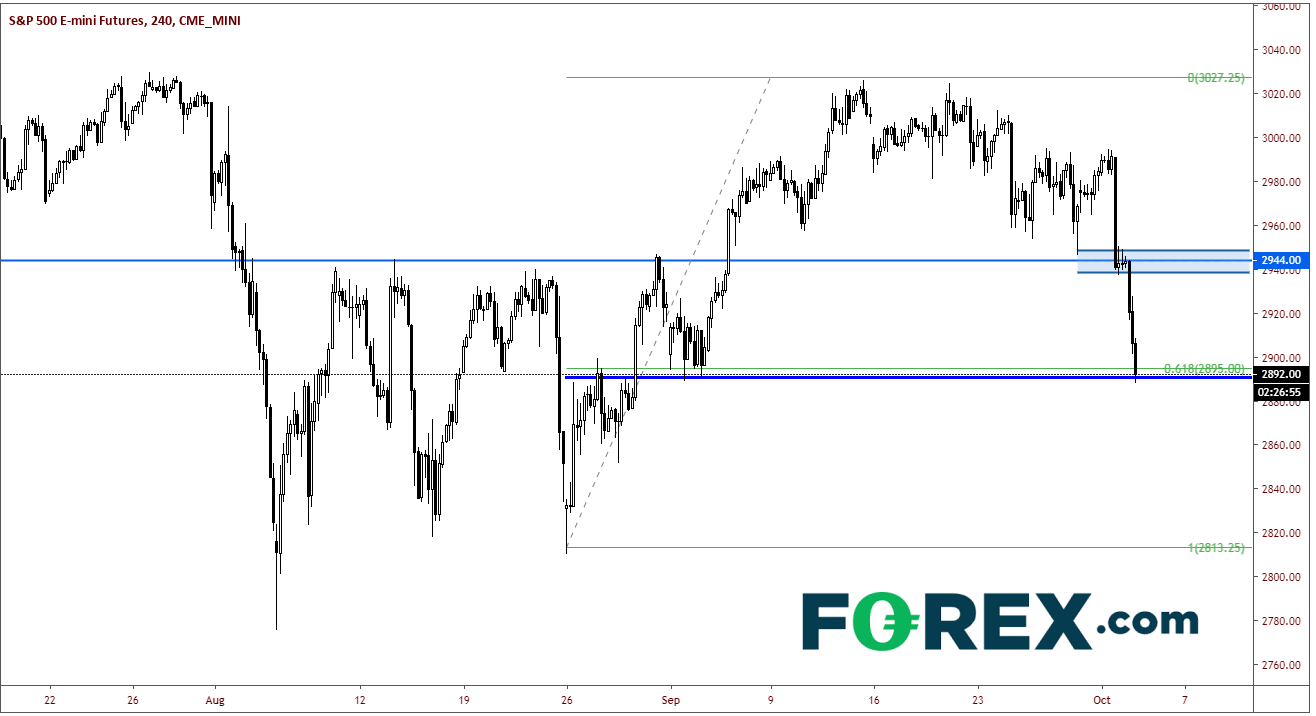
SP500 Futures continued its selloff that began yesterday after today’s worse than expected ADP Nonfarm Employment Change for September. Although the headline number was in line for the most part (135K vs 140K expected), it was the revision from August 195K down to 157K the made this data much worse than expected. This comes after yesterday’s worse than expected US ISM Manufacturing PMI for September. The index is down over 100 handles over the past 2 days near 2891. The daily chart shows SP500 Futures broke key support near 2944, which was strong horizontal resistance on the way up. Currently price is sitting at the 61.8% retracement from the August 26th lows to the September 13th highs. If price breaks lower from here, it looks possible to retrace all the way back down the 2813.
Source: Tradingview, FOREX.com, CME
If we zoom in on a 240-minute chart, resistance doesn’t come into play until way above in the 2440/2450 zone.
Source: Tradingview, FOREX.com, CME
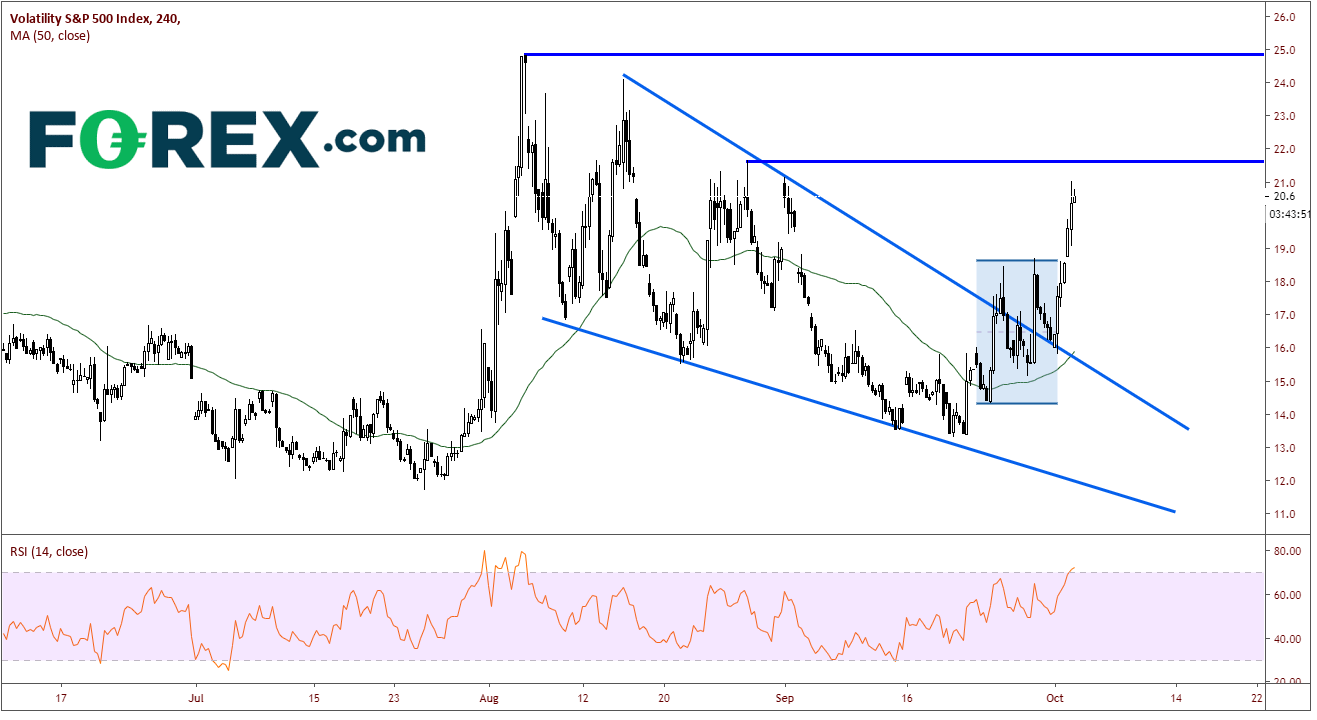
As one would expect, the Volatility SP500 Index, better know as the VIX, has gapped higher today. The 240-minute chart shows the VIX broke out of a descending wedge is late September and came back to test the downward slowing trendline twice, before finally breaking higher today. Horizontal resistance comes in at 21.60. Above that is the August 5th highs at 24.80. First support is back at the gap at 18.60. (note that the RSI is moving into overbought territory, so we may see a pullback shortly, or at least a sideways move so the RSI indicator can move back within the neutral range).
Source: Tradingview, FOREX.com
The next catalyst seems like it can come from anywhere at this point. The political is very contentious within the US, Brexit discussions are ongoing, and on Friday, the US Nonfarm Payrolls data is released. Once again, be on alert for headlines and tweets!
Related tags:
Latest market news




Open an account in minutes
Experience award-winning platforms with fast and secure execution, and enjoy tight spreads from 0.5 pts on FX and 0.3 pts on indices.
Economic calendar
Web Trader platform
Our sophisticated web-based platform is packed with features.
Related articles

Gold Update: XAU/USD Shows Neutrality Following Friday's NFP Report
The trading week is getting underway and, for now, gold has struggled to maintain the strength that characterized its performance in previous weeks. Average price action over the last two sessions shows a decline of roughly 1.5%, reflecting a loss of momentum that has started to highlight a more neutral market environment.


USD/JPY forecast: All eyes on US jobs with CPI next week – FOREX Friday
The NFP arrives today with the odds of a rate hike from the Fed slipping back to around 50% and correspondingly the dollar sold off again yesterday. That was due to comments from Fed’s Waller who said next week’s CPI could determine whether he votes for a hike or hold. He was thus a lot less hawkish than the Fed Chair Kevin Warsh.


Yen Shock Hits the Dollar Just Before the U.S. Jobs Report
Speculation about yen intervention followed a sudden drop in dollar yen, yet the selling that came after was smooth and steady rather than sharp and disorderly. Markets now carry far more Bank of Japan tightening for this year than before the late July episode. A reverse carry trade sits behind it, alongside a dollar slipping against the euro, the Australian dollar, and gold.
This report is intended for general circulation only. It should not be construed as a recommendation, or an offer (or solicitation of an offer) to buy or sell any financial products. The information provided does not take into account your specific investment objectives, financial situation or particular needs. Before you act on any recommendation that may be contained in this report, independent advice ought to be sought from a financial adviser regarding the suitability of the investment product, taking into account your specific investment objectives, financial situation or particular needs.
StoneX Financial Pte. Ltd., may distribute reports produced by its respective foreign entities or affiliates within the StoneX group of companies or third parties pursuant to an arrangement under Regulation 32C of the Financial Advisers Regulations. Where the report is distributed to a person in Singapore who is not an accredited investor, expert investor or an institutional investor (as defined in the Securities Futures Act), StoneX Financial Pte. Ltd. accepts legal responsibility to such persons for the contents of the report only to the extent required by law. Singapore recipients should contact StoneX Financial Pte. Ltd. at 6826 9988 for matters arising from, or in connection with the report.
In the case of all other recipients of this report, to the extent permitted by applicable laws and regulations neither StoneX Financial Pte. Ltd. nor its associated companies will be responsible or liable for any loss or damage incurred arising out of, or in connection with, any use of the information contained in this report and all such liability is hereby expressly disclaimed. No representation or warranty is made, express or implied, that the content of this report is complete or accurate.
StoneX Financial Pte. Ltd. is not under any obligation to update this report.
Trading CFDs carries a high level of risk that may not be suitable for some investors. Consider your investment objectives, level of experience, financial resources, risk appetite and other relevant circumstances carefully. The possibility exists that you could lose some or all of your investments, including your initial deposits. If in doubt, please seek independent expert advice. Visit www.forex.com/en-sg/terms-and-policies for the complete Risk Disclosure Statement.