




Telecoms In Focus BT and Vodafone
Telecoms is a tough industry. Here we look at Vodafone and BT post lockdown and as 5G draws into focus
Share this:

Telecoms could have some exciting times ahead of them with the rollout of 5G. However, competition is intense, and the sector is a notoriously difficult sector within which to achieve high margins. Customers and regulators will always try to get more for less. Additionally, the telecoms business often comes with large scale infrastructure which needs to be constantly improved and upgraded requiring more and more investment to remain cutting edge and ahead of the game.
BT
BT’s share price has crashed over 45% YTD and recently struck at an 11 year low after the decision to suspend dividends, in order to preserve cash amid covid uncertainty.
Whilst removing the dividend made sense, the dividend was one of the few factors preventing investors from jumping ship. BT now has a market cap of £10 billion, 4 times less than 5 years ago. When the dividend does eventually resume next year, it will most likely be a half the previous rate after management has taken the decision to invest heavily in BT’s next phase of the transformation.
BT has warned that the covid pandemic will result in a sharp fall in revenue and profits across the year. The dearth of sports and reduced activity by business clients are hitting its performance. BT Sports revenue dried up as live sporting fixtures came to a halt in lockdown. Insolvencies among small business customers are also a worry.
The need for significant modernisation and simplification across BT is clear. This includes digitalising customer journeys and moving customers onto the new 5G and fibre broadband. This of course comes at a price with £1.3 billion investment needed over 5 years. Covid is unlikely to have changed managements plans here.
Then there is the debt pile to consider which is a massive drain on cash. BT interest payments totalled £736 million just last year. However, the scale of decline at the company is alarming is probably now more alarming that the debt pile.
On the plus side BT Open reach and BT Sport are higher margin businesses and unique. BT could be considered a strong player in an extremely challenging industry.
BT Chart Thoughts
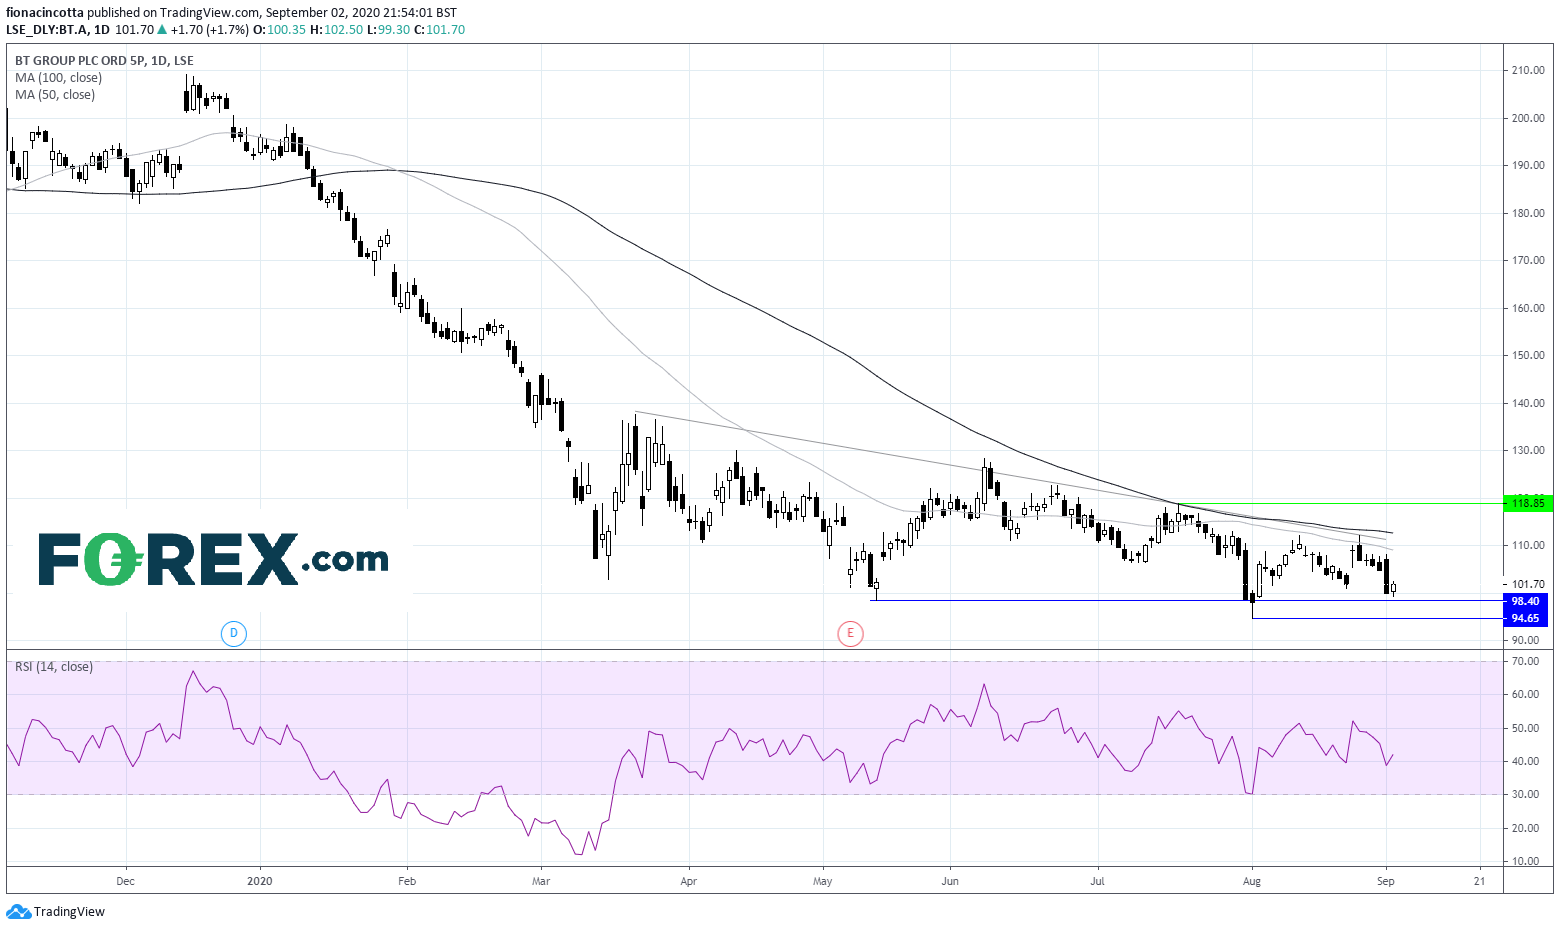
The stock is under-performing that broader market by around 14%. The stock has continued falling following the initial March covid sell off. It trades below its 50, 100 and 200 sma and below its descending trendline and is not even trading in overbought territory on the RSI, suggesting that there could be more downside to come.
98p has offered support of several occasions across the covid crisis. A fall below this level could see BT target 94p prior to targeting 80p its financial crisis low.
On the upside strong resistance can be seen around 110 – 113p where the 50 & 100 daily moving averages lies, and the descending trendline.
Vodafone
Roaming charges have been the biggest covid hit for Vodafone as travelling ground to a halt and roaming charges dried up. However, this should recover as travelling picks up again.
Debt at Vodafone is also a problem at EUE42.2 billion particularly following the purchase of Liberty Global Assets. The sale European Towers Assets and Vodafone Egypt could help bring down the debt pile. Although this does also mean the loss of a steady rent stream from the Towers.
Vodafone’s dividend has been a big part of the bull case. The dividend at Vodafone was slashed by 40% but not cut completely. The dividend still yields 6.4% - not a bad return at all and still supporting the bull case for many funds.Vodafone is looking to Liberty Global Assets for cross selling opportunities. Retention in this industry can be tough and is often improved when a customer has multiple products.
Even then, there is very little which differentiates one mobile firm from another other than price. Customers often go with the cheapest provider a lesson that Vodafone learnt the hard way with India and Spain.
Vodafone has under performed the broader market and could continue to do so for the foreseeable future.
Vodafone Chart Thoughts
Vodafone dived to mid March low of 92p. The share price then recovered testing he 200 day moving average at 142p. The price has been on the decline since. It trades below its 50, 100- and 200-day moving average and below its descending trendline indicating more selling could still be on the cards.
Immediate support can be seen 105p, a level which held mid-April. A breakthrough here could open the door to 92p.
On the flip side, important resistance can be seen at 122p, where 50 and 100 sma and the descending trendline merge. A break through this level could see more buying action.
Telecoms could have some exciting times ahead of them with the rollout of 5G. However, competition is intense, and the sector is a notoriously difficult sector within which to achieve high margins. Customers and regulators will always try to get more for less. Additionally, the telecoms business often comes with large scale infrastructure which needs to be constantly improved and upgraded requiring more and more investment to remain cutting edge and ahead of the game.
BT
BT’s share price has crashed over 45% YTD and recently struck at an 11 year low after the decision to suspend dividends, in order to preserve cash amid covid uncertainty.
Whilst removing the dividend made sense, the dividend was one of the few factors preventing investors from jumping ship. BT now has a market cap of £10 billion, 4 times less than 5 years ago. When the dividend does eventually resume next year, it will most likely be a half the previous rate after management has taken the decision to invest heavily in BT’s next phase of the transformation.
BT has warned that the covid pandemic will result in a sharp fall in revenue and profits across the year. The dearth of sports and reduced activity by business clients are hitting its performance. BT Sports revenue dried up as live sporting fixtures came to a halt in lockdown. Insolvencies among small business customers are also a worry.
The need for significant modernisation and simplification across BT is clear. This includes digitalising customer journeys and moving customers onto the new 5G and fibre broadband. This of course comes at a price with £1.3 billion investment needed over 5 years. Covid is unlikely to have changed managements plans here.
Then there is the debt pile to consider which is a massive drain on cash. BT interest payments totalled £736 million just last year. However, the scale of decline at the company is alarming is probably now more alarming that the debt pile.
On the plus side BT Open reach and BT Sport are higher margin businesses and unique. BT could be considered a strong player in an extremely challenging industry.
BT Chart Thoughts
The stock is under-performing that broader market by around 14%. The stock has continued falling following the initial March covid sell off. It trades below its 50, 100 and 200 sma and below its descending trendline and is not even trading in overbought territory on the RSI, suggesting that there could be more downside to come.
98p has offered support of several occasions across the covid crisis. A fall below this level could see BT target 94p prior to targeting 80p its financial crisis low.
On the upside strong resistance can be seen around 110 – 113p where the 50 & 100 daily moving averages lies, and the descending trendline.
Vodafone
Roaming charges have been the biggest covid hit for Vodafone as travelling ground to a halt and roaming charges dried up. However, this should recover as travelling picks up again.
Debt at Vodafone is also a problem at EUE42.2 billion particularly following the purchase of Liberty Global Assets. The sale European Towers Assets and Vodafone Egypt could help bring down the debt pile. Although this does also mean the loss of a steady rent stream from the Towers.
Vodafone’s dividend has been a big part of the bull case. The dividend at Vodafone was slashed by 40% but not cut completely. The dividend still yields 6.4% - not a bad return at all and still supporting the bull case for many funds.Vodafone is looking to Liberty Global Assets for cross selling opportunities. Retention in this industry can be tough and is often improved when a customer has multiple products.
Even then, there is very little which differentiates one mobile firm from another other than price. Customers often go with the cheapest provider a lesson that Vodafone learnt the hard way with India and Spain.
Vodafone has under performed the broader market and could continue to do so for the foreseeable future.
Vodafone Chart Thoughts
Vodafone dived to mid March low of 92p. The share price then recovered testing he 200 day moving average at 142p. The price has been on the decline since. It trades below its 50, 100- and 200-day moving average and below its descending trendline indicating more selling could still be on the cards.
Immediate support can be seen 105p, a level which held mid-April. A breakthrough here could open the door to 92p.
On the flip side, important resistance can be seen at 122p, where 50 and 100 sma and the descending trendline merge. A break through this level could see more buying action.
Related tags:
Latest market news




Open an account in minutes
Experience award-winning platforms with fast and secure execution, and enjoy tight spreads from 0.5 pts on FX and 0.3 pts on indices.
Economic calendar
Web Trader platform
Our sophisticated web-based platform is packed with features.
Related articles

S&P 500, Nasdaq, Dow Forecast: Rising Yields Test Rally Ahead of Nvidia, Fed 8 22 2026
S&P 500, Nasdaq and Dow test key technical levels as momentum fades, raising the risk of a deeper correction heading into a pivotal week.


Magnificent Seven Earnings Preview: Can Big Tech Reclaim AI Leadership?
The Magnificent Seven enter earnings with far more divided performance than in previous years, as investors increasingly distinguish between companies supplying the AI buildout and those funding it - what does that mean heading into earnings season?


USD/JPY unwind accelerates as GPIF headlines spark yen buying
Japanese assets are rallying after the government floated the prospect of the GPIF investing more heavily at home. While the proposal could have significant implications for global capital flows, it does not yet change the broader forces driving Japanese bond yields and USD/JPY.

This report is intended for general circulation only. It should not be construed as a recommendation, or an offer (or solicitation of an offer) to buy or sell any financial products. The information provided does not take into account your specific investment objectives, financial situation or particular needs. Before you act on any recommendation that may be contained in this report, independent advice ought to be sought from a financial adviser regarding the suitability of the investment product, taking into account your specific investment objectives, financial situation or particular needs.
StoneX Financial Pte. Ltd., may distribute reports produced by its respective foreign entities or affiliates within the StoneX group of companies or third parties pursuant to an arrangement under Regulation 32C of the Financial Advisers Regulations. Where the report is distributed to a person in Singapore who is not an accredited investor, expert investor or an institutional investor (as defined in the Securities Futures Act), StoneX Financial Pte. Ltd. accepts legal responsibility to such persons for the contents of the report only to the extent required by law. Singapore recipients should contact StoneX Financial Pte. Ltd. at 6826 9988 for matters arising from, or in connection with the report.
In the case of all other recipients of this report, to the extent permitted by applicable laws and regulations neither StoneX Financial Pte. Ltd. nor its associated companies will be responsible or liable for any loss or damage incurred arising out of, or in connection with, any use of the information contained in this report and all such liability is hereby expressly disclaimed. No representation or warranty is made, express or implied, that the content of this report is complete or accurate.
StoneX Financial Pte. Ltd. is not under any obligation to update this report.
Trading CFDs carries a high level of risk that may not be suitable for some investors. Consider your investment objectives, level of experience, financial resources, risk appetite and other relevant circumstances carefully. The possibility exists that you could lose some or all of your investments, including your initial deposits. If in doubt, please seek independent expert advice. Visit www.forex.com/en-sg/terms-and-policies for the complete Risk Disclosure Statement.