




US dollar ponders correction as bond prices approach support
The US dollar has risen around 6% from the late December low. And with bond prices approaching support which could send yields lower, the US dollar rally could at least find some headwinds - if not a retracement.
Share this:

For much of this year I have been able to keep ahead of the US dollar’s moves simply by assessing the gap between the market’s expectations of multiple Fed cuts, compared with the unlikely event the Fed were to become as dovish as they intended. The dynamic was quite simply; as fewer cuts were gradually priced in, yields and the US dollar rose on the ‘higher for longer’ narrative.
Yet now markets have all but given up on cuts this year and the Fed have realised they’re in no rush to cut, the gap between market pricing and Fed expectations has vanished. And the dynamic has now changed.
The US dollar and yields continue to share a positive correlation, but yields and the US dollar are actually lower since Jerome Powell effectively poured cold water imminent rate cuts.
So what happened to ‘higher for longer = stronger yields and dollar’?
If yields are lower, it means investors are scooping up bonds. And if bond investors suspect the Fed are taking the fight against inflation more seriously via elevated rates, bonds could look attractive on the bet the tighter-for-longer policy will slow growth and inflation, and weigh on yields.
There may also be technical reasons for higher yields. As both the US 2-year note and 10-year bond have fallen to previous resistance levels. The 10-year is admittedly a tad spurious, but the 94-95 area has provided support on and off since 2021. And of bond investors are buying around support levels, it could send yields lower if bond prices retrace higher from here.
US dollar technical analysis (monthly and weekly chart):
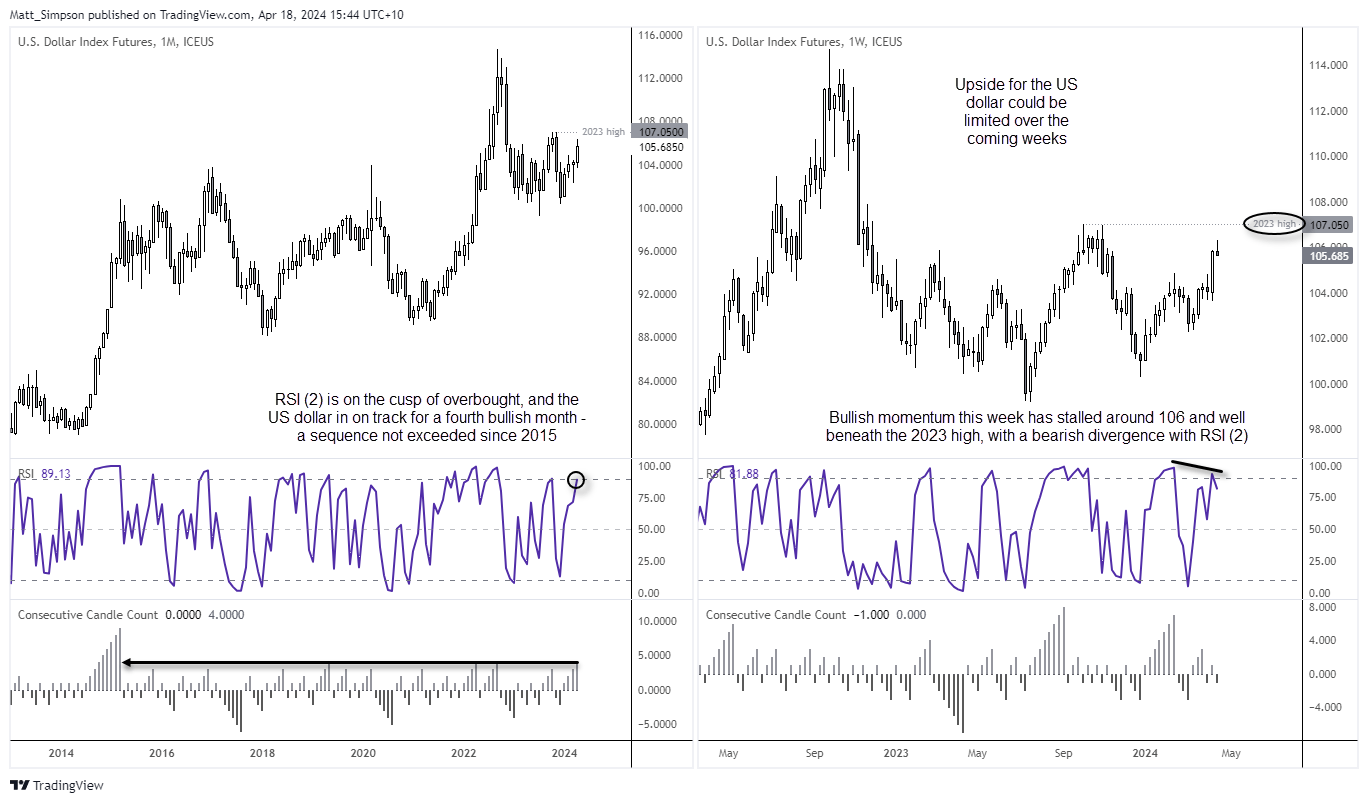
Whilst April has averaged negative returns for the US dollar, it seems very unlikely to play out this year given the dollar has risen 1.3% month to date. Yet it is now within its fourth consecutive bullish month, a sequence it has not exceed since 2015. The monthly RSI (2) is also on the cusp of reaching overbought. A bearish divergence is forming on the weekly RSI (2), and momentum this week has waned around 106 – and well beneath the 2023 high.
Whilst none of this confirms an imminent top, I suspect we’re closer to the end of this leg higher than the beginning, or even the middle. Therefore, I will be seeking evidence of a swing high on the higher timeframes on the US dollar over the coming weeks.
US dollar technical analysis (daily chart):
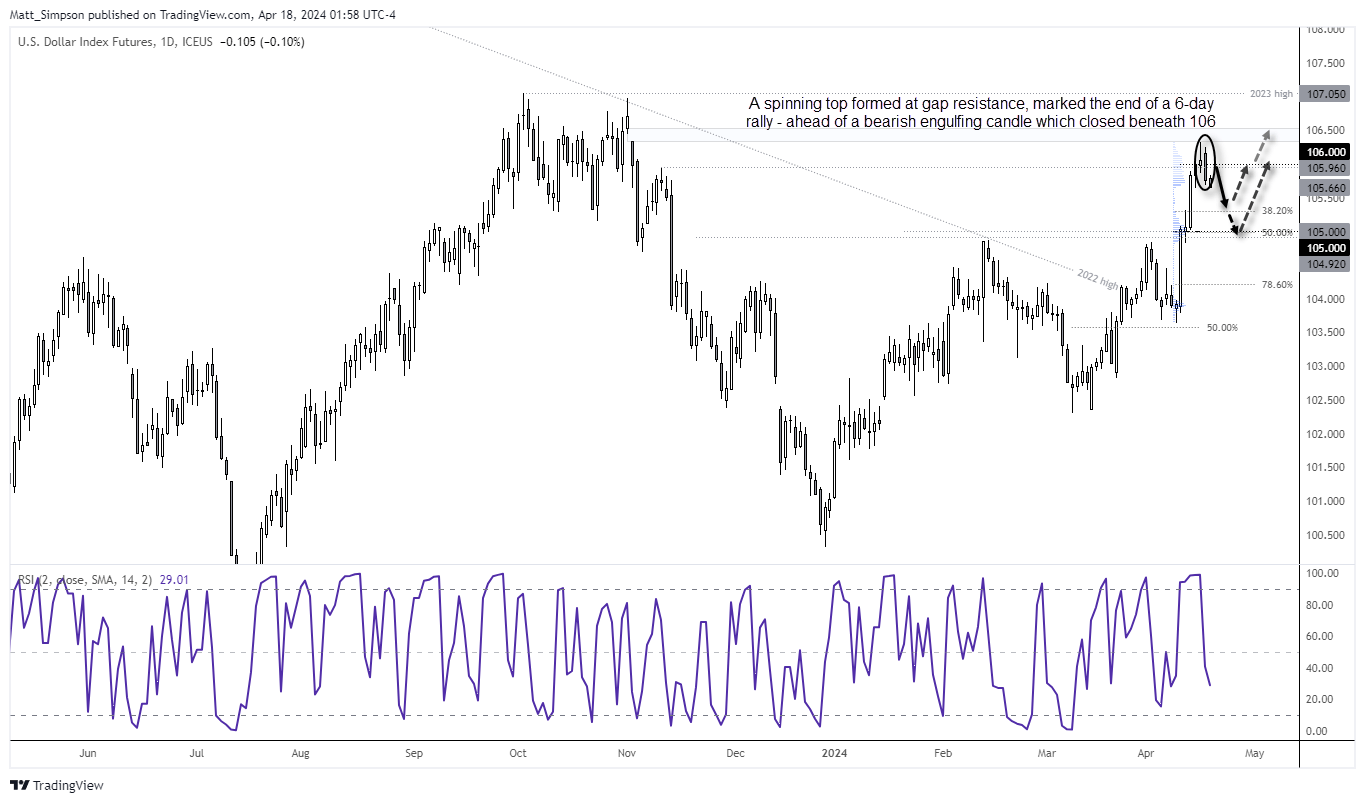
The daily chart shows that the US dollar index snapped a 6-day bullish streak on Wednesday, a sequence not achieved since September (which actually saw a 7-day rally). Its high perfectly respected the lower gap from late October and formed a spinning top doji, which was followed by a bearish engulfing candle. Momentum has turned lower in Thursday’s Asian trade, and the bias is for a move to at least 105.50.
Bears could seek to fade into minor rallies beneath the 106 handle, with 105.50, 105.30 (38.2% Fibonacci) and 105 (high-volume node and 50% level) in focus for bears.
-- Written by Matt Simpson
Follow Matt on Twitter @cLeverEdge
How to trade with City Index
You can trade with City Index by following these four easy steps:
- Open an account, or log in if you’re already a customer
• Open an account in the UK
• Open an account in Australia
• Open an account in Singapore
- Search for the market you want to trade in our award-winning platform
- Choose your position and size, and your stop and limit levels
- Place the trade
Latest market news



Open an account in minutes
Experience award-winning platforms with fast and secure execution, and enjoy tight spreads from 0.5 pts on FX and 0.3 pts on indices.
Economic calendar
Web Trader platform
Our sophisticated web-based platform is packed with features.
Related articles
S&P 500 forecast: Stocks extend drop as correction risks grow
US and global equity markets have extended Wednesday’s sell-off, with Wall Street opening lower after a weak handover from Asia and Europe. The deterioration in risk appetite has been spreading across global markets. The dollar was firmer, Treasury yields were holding onto yesterday’s gains, while gold, silver and bitcoin were all under pressure alongside equities and major currencies.
Wall Street Forecast: DJIA falls as treasury yields hit new highs and ahead of the Trump-Xi summit
U.S. stocks are falling, further extending losses from the previous session, as oil prices move higher alongside Treasury yields and caution reigns ahead of the summit between President Trump and Xi Jinping.

GBP/USD, DJIA Outlook: Support Levels Meet Oversold Risks
GBP/USD and the Dow test key support levels as rising Treasury yields, Fed rate-hike expectations and oversold momentum increase reversal risks.

This report is intended for general circulation only. It should not be construed as a recommendation, or an offer (or solicitation of an offer) to buy or sell any financial products. The information provided does not take into account your specific investment objectives, financial situation or particular needs. Before you act on any recommendation that may be contained in this report, independent advice ought to be sought from a financial adviser regarding the suitability of the investment product, taking into account your specific investment objectives, financial situation or particular needs.
StoneX Financial Pte. Ltd., may distribute reports produced by its respective foreign entities or affiliates within the StoneX group of companies or third parties pursuant to an arrangement under Regulation 32C of the Financial Advisers Regulations. Where the report is distributed to a person in Singapore who is not an accredited investor, expert investor or an institutional investor (as defined in the Securities Futures Act), StoneX Financial Pte. Ltd. accepts legal responsibility to such persons for the contents of the report only to the extent required by law. Singapore recipients should contact StoneX Financial Pte. Ltd. at 6826 9988 for matters arising from, or in connection with the report.
In the case of all other recipients of this report, to the extent permitted by applicable laws and regulations neither StoneX Financial Pte. Ltd. nor its associated companies will be responsible or liable for any loss or damage incurred arising out of, or in connection with, any use of the information contained in this report and all such liability is hereby expressly disclaimed. No representation or warranty is made, express or implied, that the content of this report is complete or accurate.
StoneX Financial Pte. Ltd. is not under any obligation to update this report.
Trading CFDs carries a high level of risk that may not be suitable for some investors. Consider your investment objectives, level of experience, financial resources, risk appetite and other relevant circumstances carefully. The possibility exists that you could lose some or all of your investments, including your initial deposits. If in doubt, please seek independent expert advice. Visit www.forex.com/en-sg/terms-and-policies for the complete Risk Disclosure Statement.