



US Dollar Price Action Setups: USD/JPY, EUR/USD, GBP/USD, Gold, S&P 500
The next two weeks are huge with PPI, CPI and then next week’s FOMC meeting, with the wide expectation that we see a 25 bp hike less than two months before mid-term elections.
Share this:

USD Talking Points:
- Expectations remain high for at least 25 bps of hikes into the end of the year with a greater than 50% chance that we see that at next Wednesday’s FOMC rate decision. The PPI and CPI prints to be released later this week are key for that meeting.
- USD/JPY remains key for FX markets as the crowded carry trade presents significant USD risk, which can drive through other markets such as EUR/USD, GBP/USD and AUD/USD.
- What should be clear at this point is that both Scott Bessent and the Bank of Japan have unnerved markets and given a theoretical cap to upside, bullish USD/JPY setups at or above 160 present a challenge, as I wrote a couple weeks ago. Now, the big question is whether the pair can bounce into a lower-high and that CPI data point is a big one for several reasons.
- USD/JPY reversals in 2022, 2023 and 2024 were driven more by US CPI than a direct response to intervention, although the latter establishing a line in the sand was a key first step.
The Bank of Japan has intervened multiple times since the spark of the USD/JPY carry trade now more than five years ago. In that time, we’ve seen Japanese inflation flare (and settle down) and we’ve had a stern bout of inflation in the United States that was initially dismissed in 2021, only for the Fed to go on a historic hiking spree in 2022.
Even though the Fed did not hike in 2021, USD/JPY started to gain; and that rally went parabolic in 2022 as the Fed did begin to actually hike as the carry trade took over. After starting 2021 in the 102’s the pair jumped up to the 150 mark in 2022 – a massive move for any market but especially more outsized considering the connotation that this is the exchange rate between two of the world’s largest national economies.
Ever since then the carry has remained tilted to the long side of the pair and that remains the case today. As such, there’s many longs that are still holding on and this derives from both positional trades as well as hedges on underlying carry trades – from banks or hedge funds that borrowed funds cheaply in Japan and then invested those funds. Warren Buffett had done something similar, although he borrowed in Japanese Yen and then invested in Japanese banks.
As long as the rate disparity remains in-place so too can a fundamental bias for the market. But – fundamentals aren’t the only thing that matters as it’s positioning – actual buying and selling and legitimate supply and demand that dominate price movements. And for USD/JPY, it’s US CPI prints over the past four years that have had a massive impact on the matter.
In 2022 when USD/JPY crested above the 150.00 level, the BoJ was ordered to intervene. And that was enough to push prices back to a support test of 145, but like we’ve seen with recent episodes, that merely invited more buyers into the mix as prices bounced in the aftermath. But as price re-approached the 150.00 level, the perceived risk-reward grew less attractive, and while there was still motive for bulls to buy dips, there was less to hold on at that contentious line-in-the-sand that had invited action previously.
What ultimately drove the reversal in November of 2022 was a below-expected US CPI print. Headline CPI was at 7.1% and Core CPI was at 6.3%. And, at the time, there wasn’t exactly thoughts of the BoJ hiking rates so the fundamental bias was very much in-place. But – given the change, the fact that US inflation had started to slow and, perhaps, markets had seen the Fed at their most hawkish, there was enough motive to shake longs out of the trade, leading to a 2,000+ pip sell-off that spanned the next two months.
At this point, we’ve had the theoretical line drawn in the sand with the 160.00 handle but we haven’t yet seen a convincing turn in the data that’s compelled longs to bail. That can change with Friday’s release of CPI data. Until then, there’s a possible counter-trend setup in USD/JPY as the daily bar has shown an elongated underside wick, very similar to what showed a month ago after the intervention push. If the daily bar closes as a hammer or perhaps even as a dragonfly doji, the door opens to a bounce. But more important is how sellers treat that and whether they come in at a lower-high, inside of the 160 level that set resistance a week ago.
USD/JPY Daily Price Chart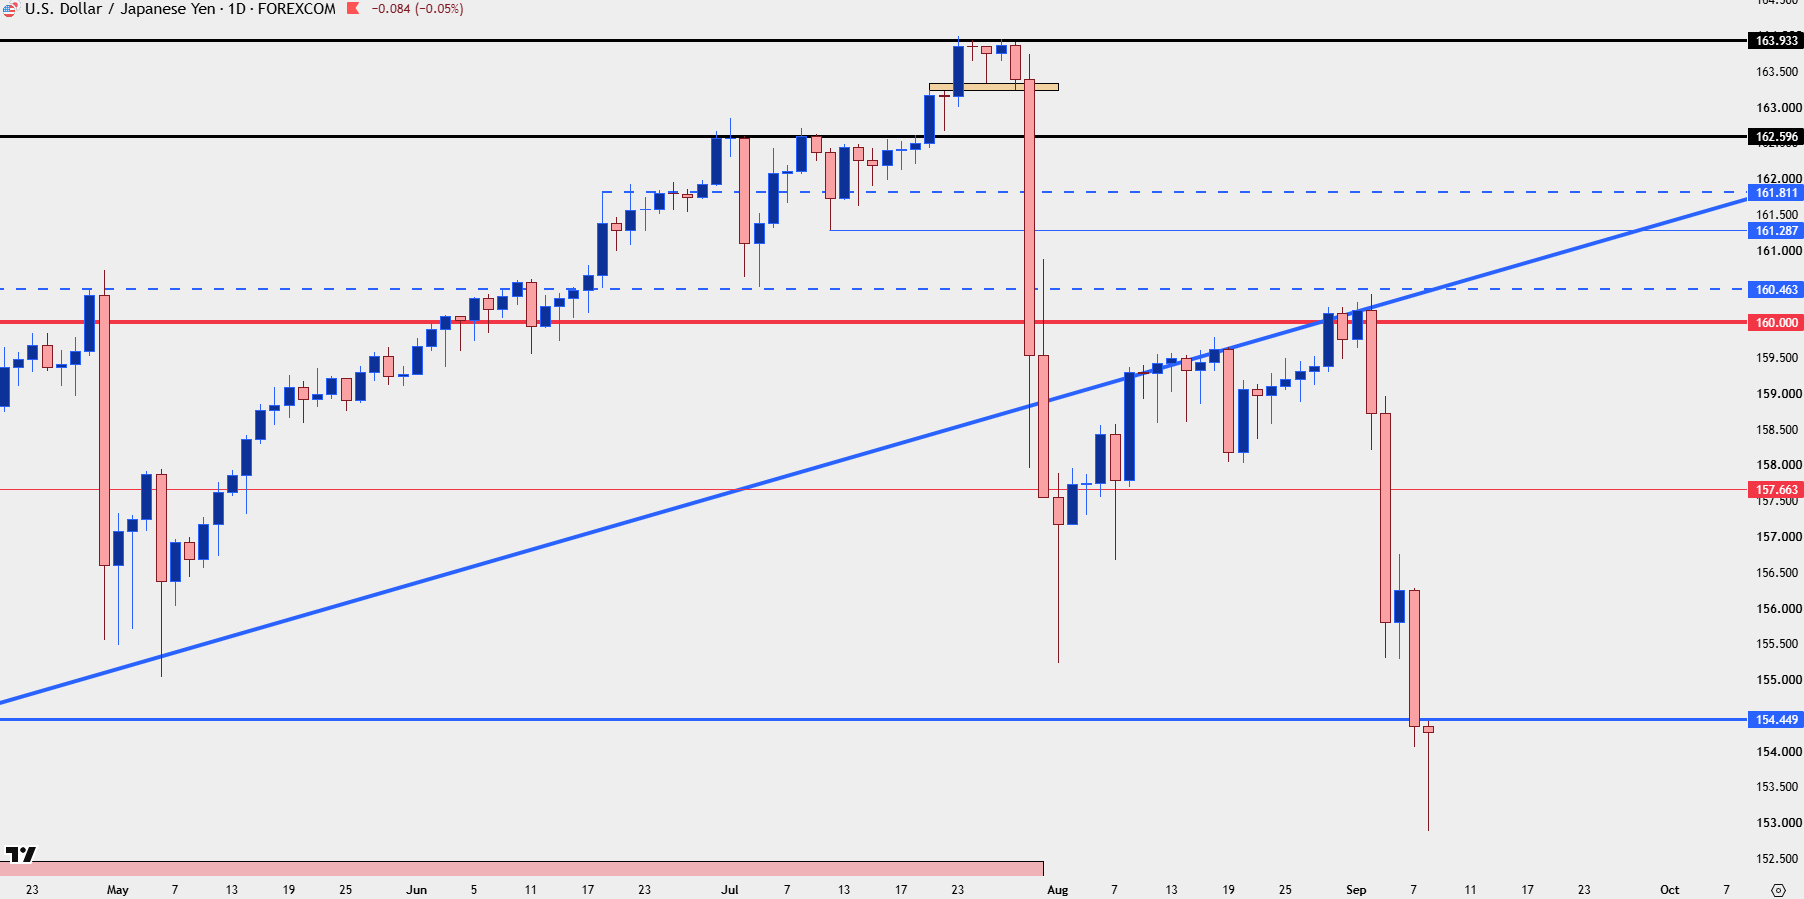
Chart prepared by James Stanley; data derived from Tradingview
USD
As looked at in the webinar DXY is difficult to chase lower, at the moment. If the daily bar finishes as a doji that further points to bounce potential given what could be the set up of a higher-low. Next resistance up is around 99.42 for the Dollar basket.
US Dollar, DXY Daily Price Chart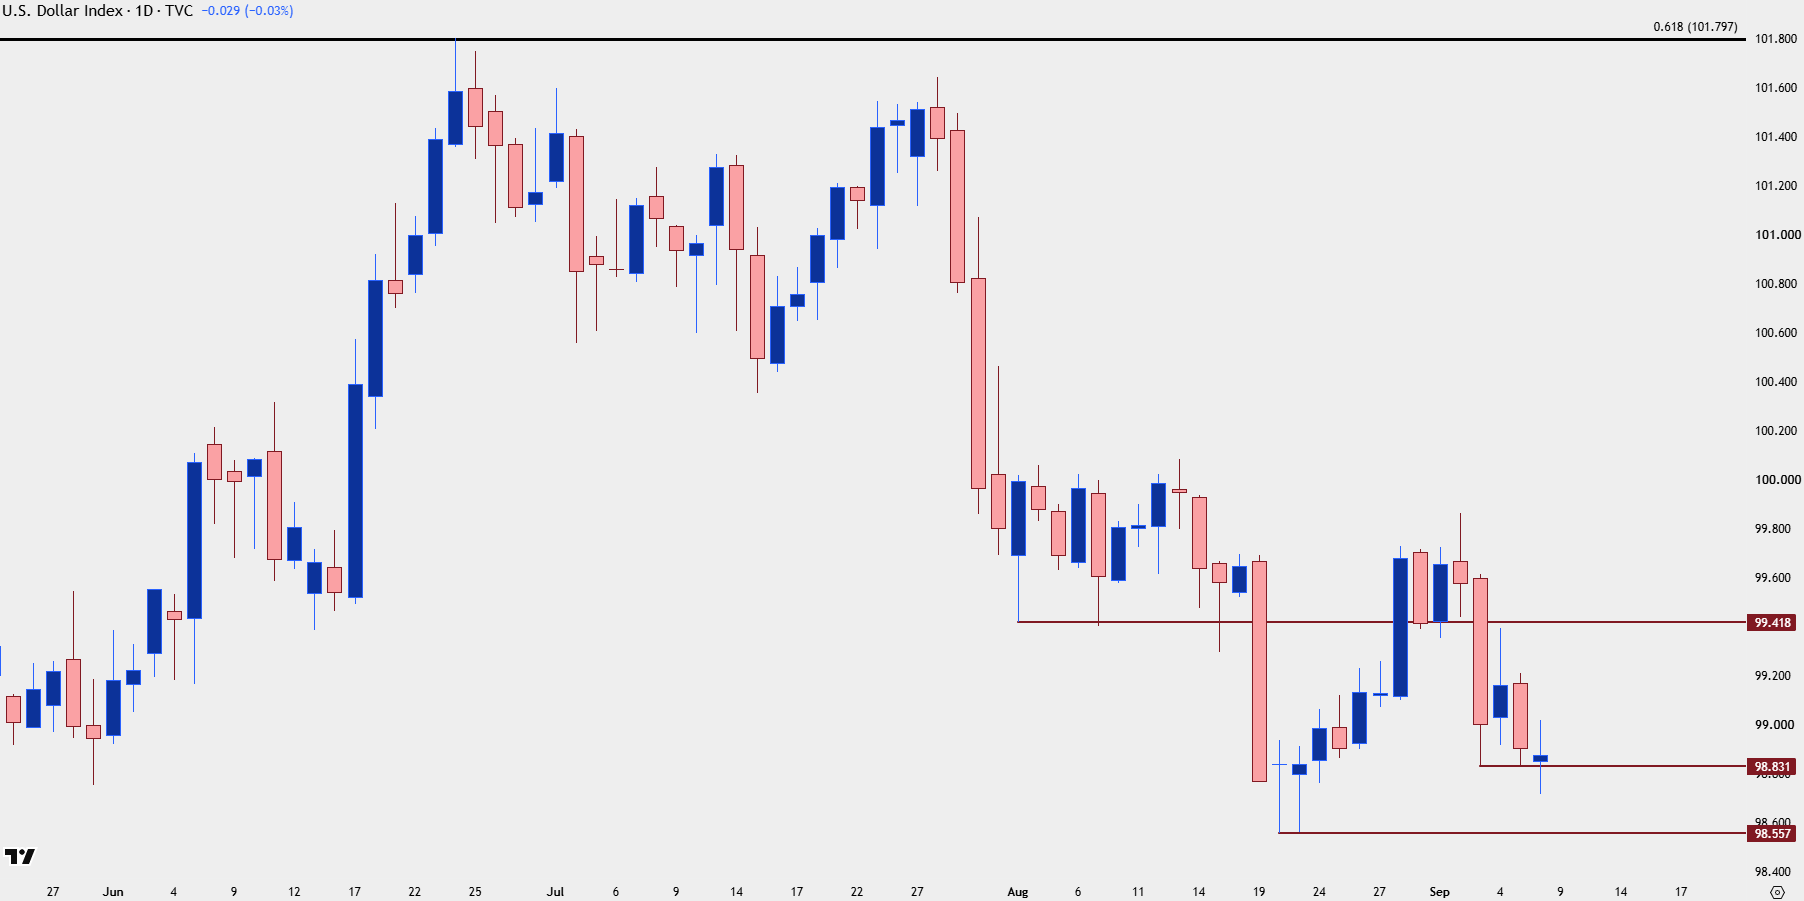
Chart prepared by James Stanley; data derived from Tradingview
EUR/USD
I like boring markets. While there may be lower odds of dramatic moves like we’ve seen in USD/JPY, there’s also a more reasonable backdrop with which to manage risk.
At Thursday’s ECB meeting the wide expectation is that the bank will lift rates by 25 bps. But EUR/USD seems to have already priced that in and, instead, broader Dollar dynamics from the USD/JPY situation are carrying significant weight.
At this point, I still have the pair in support taken from prior resistance and I’m keeping this one aligned for USD-weakness scenarios. Next resistance up spans from 1.1669-1.1686.
EUR/USD Daily Price Chart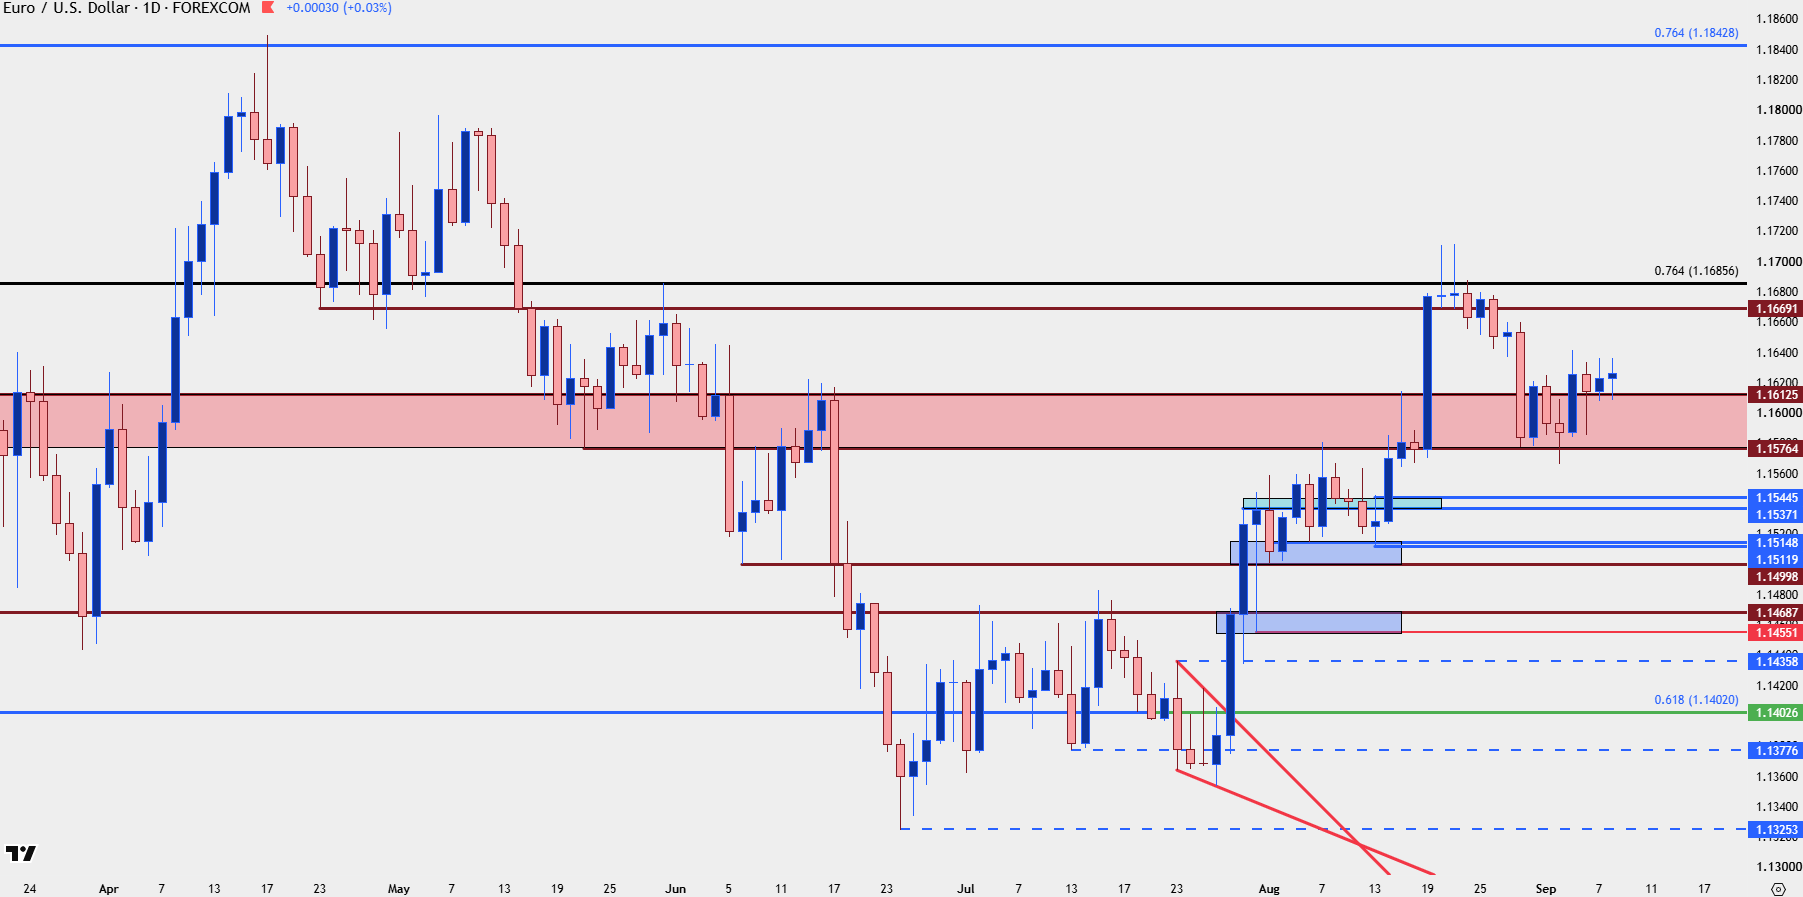
Chart prepared by James Stanley; data derived from Tradingview
GBP/USD
GBP/USD may present an even cleaner backdrop for USD-weakness, as there’s a short-term formation that resembles an inverse head and shoulders pattern. The neckline of that formation derives from a prior swing high, at 1.3558 with follow-through resistance at 1.3595 and 1.3620.
GBP/USD Four Hour Chart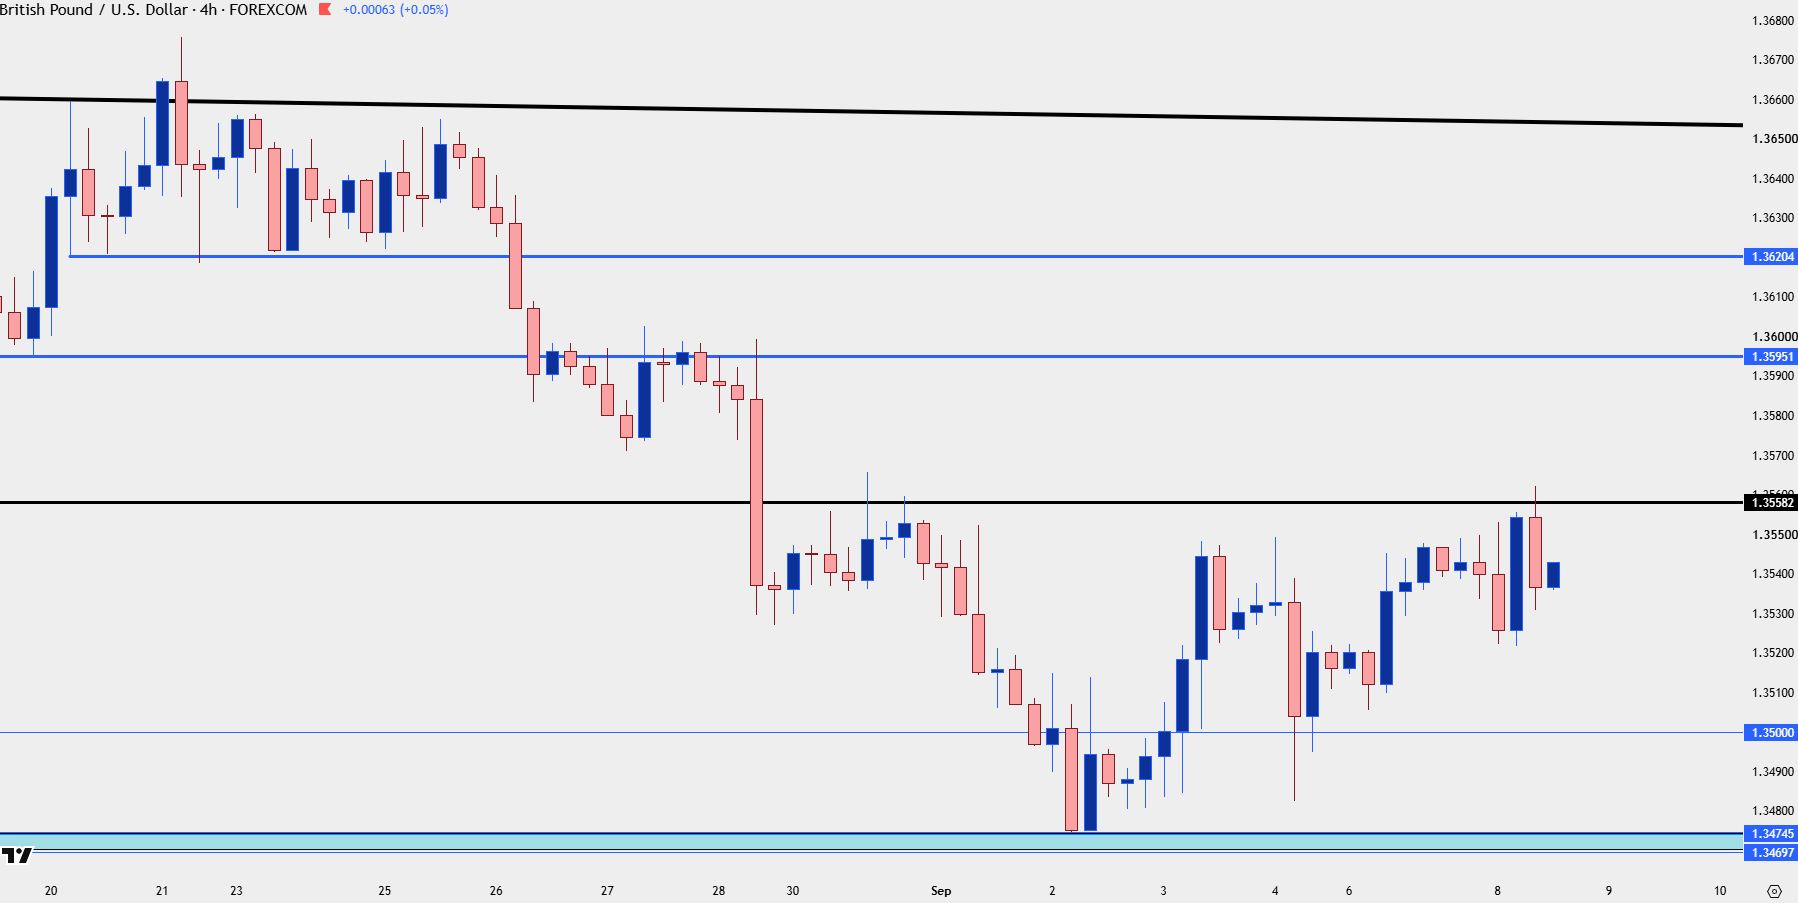
Chart prepared by James Stanley; data derived from Tradingview
Gold
Gold took a punch last week and buyers still haven’t been able to take over. Ahead of the Kevin Warsh speech at Jackson Hole I looked into the matter, highlighting pullback potential if markets came away with a bullish read from the speech. Similar setups in ES and Bitcoin did see a follow-through bullish response but gold, so far, has not, as last week produced another lower-low and the bounce from that has been rather flat so far this week.
Nonetheless, buyers can still make a statement here but they’ll need to push above 4435 to establish a short-term higher-high; or else, the look would be for some element of defense on a deeper drawdown around the swing support at 4300 from last week.
Gold Four-Hour Chart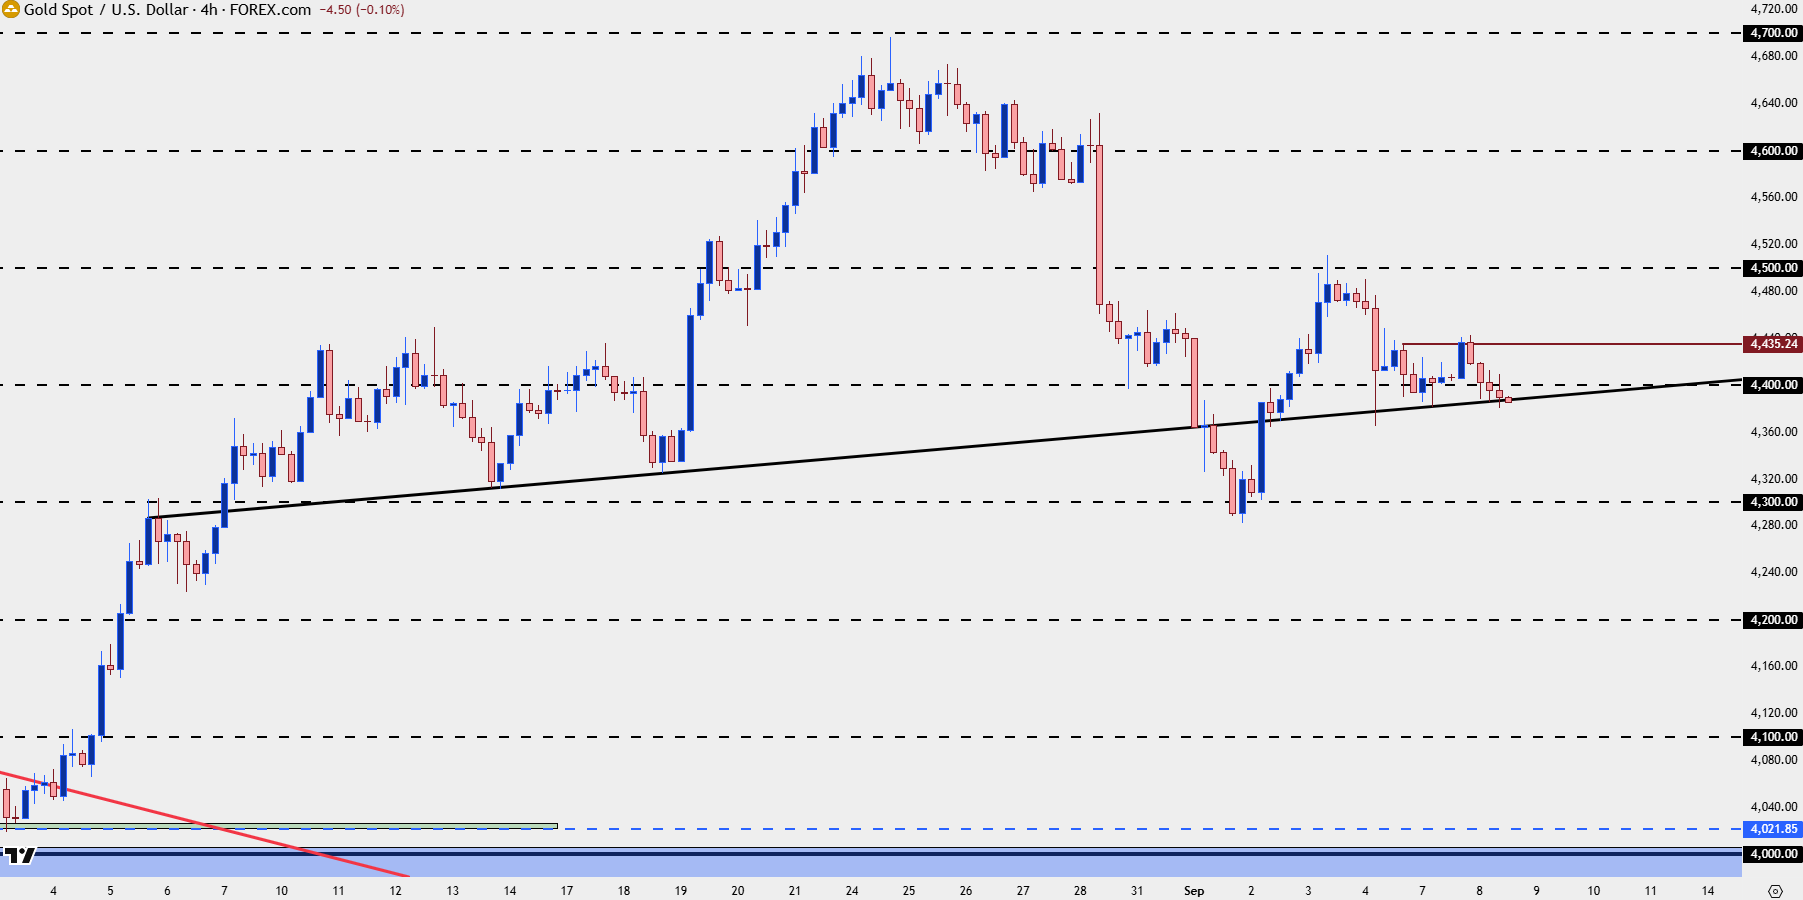
Chart prepared by James Stanley; data derived from Tradingview
S&P 500
While gold didn’t respond positively to the pullback, at least not yet, the S&P 500 has. Last week saw price move down to the key support level highlighted in the above-linked video, and this spans a zone of prior resistance, from around 7632-7642. With Trump and Bessent’s ‘we will grow our way out of debt’ strategy, there’s still motive for bullish biases.
That said, a shocking inflation print later in the week can strengthen rate hike expectations which could drive a pullback in equities, and I would similarly look at that as opportunity for the broader trend until something shifts in the backdrop.
There’s deeper support around the 7500 level which is confluent with the 61.8% retracement of the recent rally.
S&P 500 Futures Daily Price Chart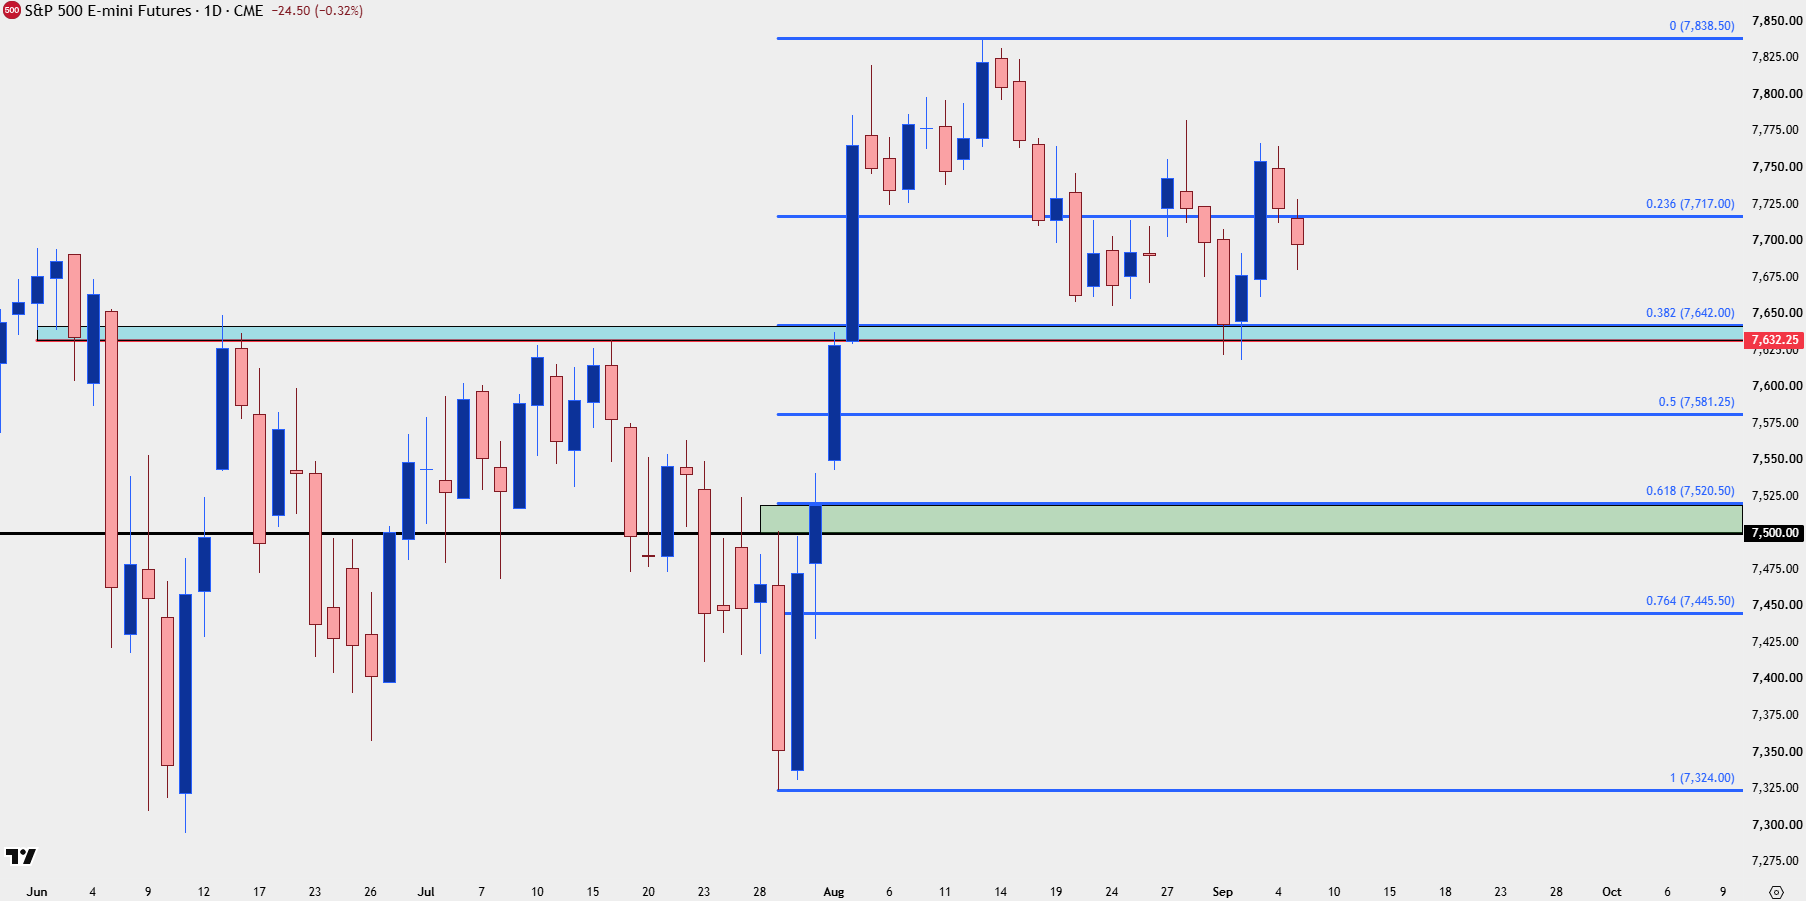
Chart prepared by James Stanley; data derived from Tradingview
--- written by James Stanley, Senior Market Analyst, Global Macro


Open an account in minutes
Experience award-winning platforms with fast and secure execution, and enjoy tight spreads from 0.5 pts on FX and 0.3 pts on indices.
Economic calendar
Web Trader platform
Our sophisticated web-based platform is packed with features.
Related articles
AUD/USD hammered by US yields and fading RBA hike bets
US yields, dollar strength and fading RBA hike bets have combined to drive AUD/USD to fresh multi-month lows. The macro and technical bias remains bearish, although history suggests parts of the move are now reaching unusually stretched levels.

Japanese Yen Outlook: USD/JPY, GBP/JPY, AUD/JPY Setups
USD/JPY and GBP/JPY show signs of stabilising, while AUD/JPY remains vulnerable as yen crosses deliver mixed technical signals.


Gold Price Outlook: XAU/USD Resistance at $4200 Sets Up for NFP
It was a strong sell-off to start the week in gold and despite a Tuesday bounce, sellers are continuing to push following a resistance hit at the $4200 level.
This report is intended for general circulation only. It should not be construed as a recommendation, or an offer (or solicitation of an offer) to buy or sell any financial products. The information provided does not take into account your specific investment objectives, financial situation or particular needs. Before you act on any recommendation that may be contained in this report, independent advice ought to be sought from a financial adviser regarding the suitability of the investment product, taking into account your specific investment objectives, financial situation or particular needs.
StoneX Financial Pte. Ltd., may distribute reports produced by its respective foreign entities or affiliates within the StoneX group of companies or third parties pursuant to an arrangement under Regulation 32C of the Financial Advisers Regulations. Where the report is distributed to a person in Singapore who is not an accredited investor, expert investor or an institutional investor (as defined in the Securities Futures Act), StoneX Financial Pte. Ltd. accepts legal responsibility to such persons for the contents of the report only to the extent required by law. Singapore recipients should contact StoneX Financial Pte. Ltd. at 6826 9988 for matters arising from, or in connection with the report.
In the case of all other recipients of this report, to the extent permitted by applicable laws and regulations neither StoneX Financial Pte. Ltd. nor its associated companies will be responsible or liable for any loss or damage incurred arising out of, or in connection with, any use of the information contained in this report and all such liability is hereby expressly disclaimed. No representation or warranty is made, express or implied, that the content of this report is complete or accurate.
StoneX Financial Pte. Ltd. is not under any obligation to update this report.
Trading CFDs carries a high level of risk that may not be suitable for some investors. Consider your investment objectives, level of experience, financial resources, risk appetite and other relevant circumstances carefully. The possibility exists that you could lose some or all of your investments, including your initial deposits. If in doubt, please seek independent expert advice. Visit www.forex.com/en-sg/terms-and-policies for the complete Risk Disclosure Statement.