




USD/CAD Breakout: Insights on Extremes in Sentiment & Momentum
While the Trump bump may have been the catalyst, the USD/CAD rally was largely driven by extremes in both sentiment and momentum. A breakdown of the Loonie breakout.
Share this:

One of the most prominent moves of the year occurred in December as USD/CAD broke through major technical resistance. The move unleashed a rally of more than 3.1% into the close of the year with price breaking to fresh multi-year highs.
Canadian Dollar Price Chart- USD/CAD Monthly
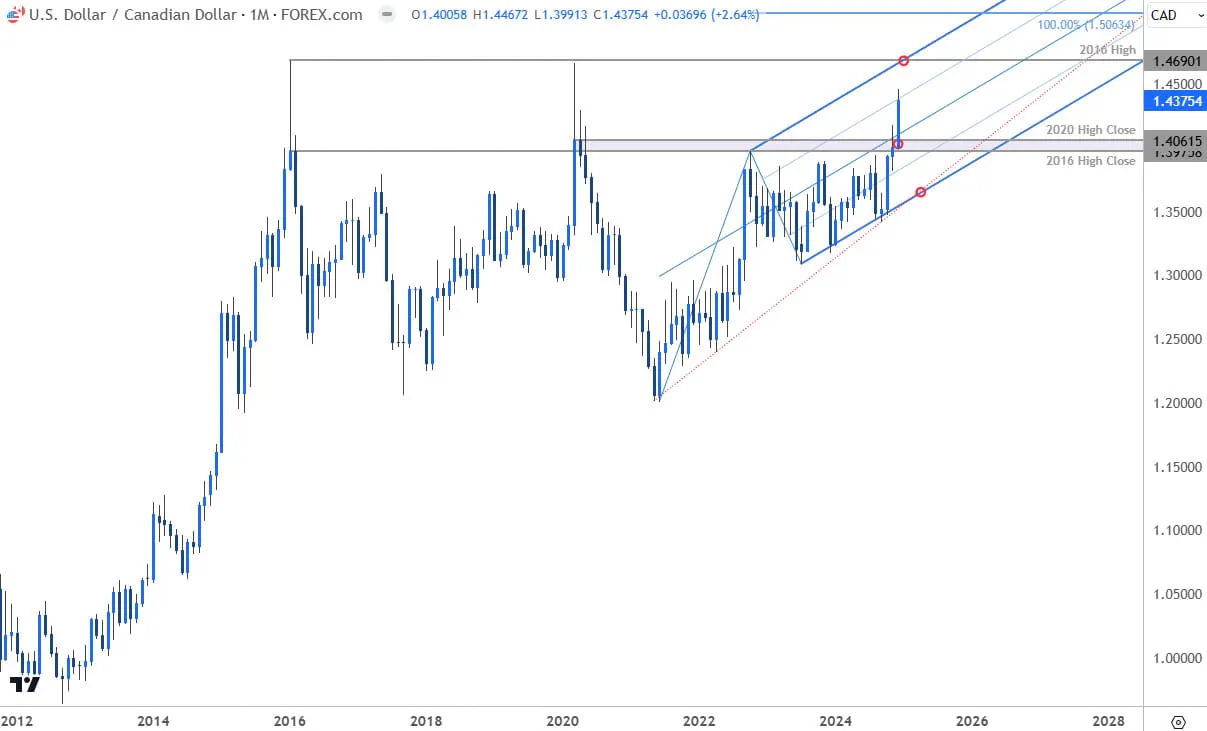
Chart Prepared by Michael Boutros, Sr. Technical Strategist; USD/CAD on TradingView
A major pivot zone was tested on the heels of the U.S. election at the 2016 / 2020 high closes at 1.3975-1.4062 with the Trump rally breaking through the median-line of a modified pitchfork extending off the 2021 low. The breakout takes price into low-tolerance range that has seen numerous exhaustion points into the 2016 high at 1.4990.
USD/CAD Client Sentiment
Client Sentiment Indicator represents client positions held through FOREX.com
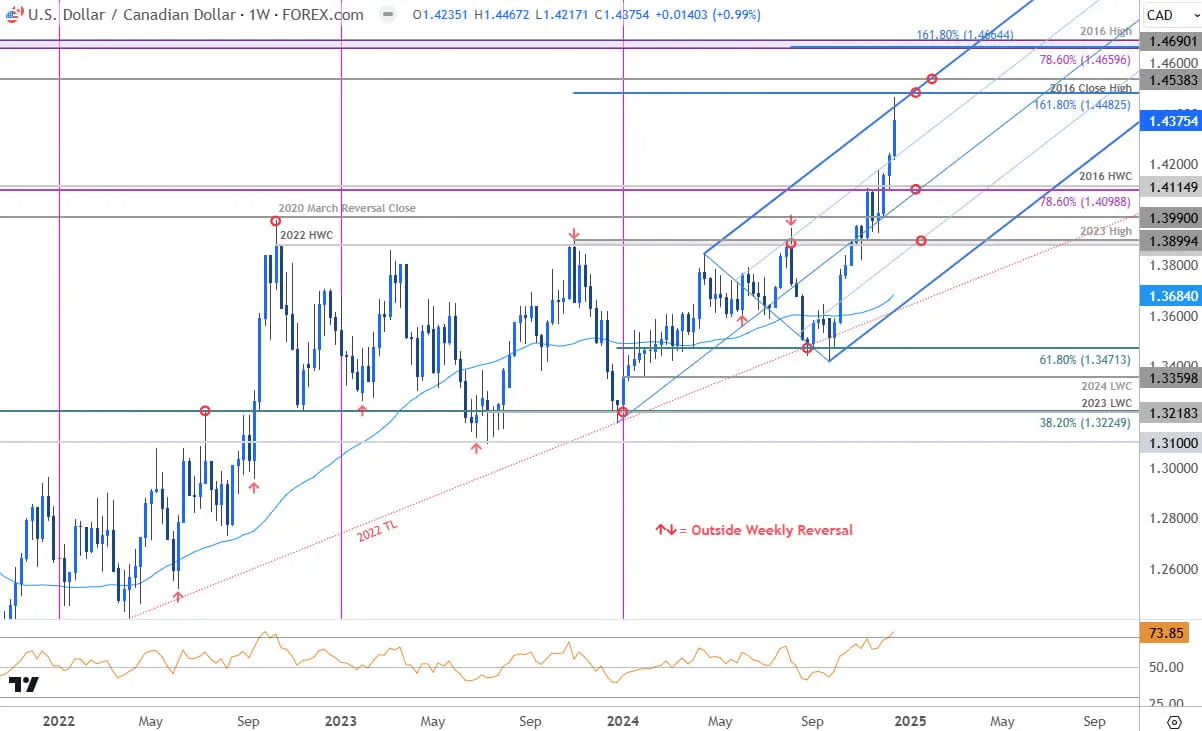
A remarkable feature of this move was the continued build in retail short-exposure as traders attempted to fade a massive wave of momentum. At the same time, weekly momentum had broken into overbought territory for the first time since 2022- in that instance, price had mounted a breakout to fresh yearly highs that extended another 5.4% in the following weeks before exhausting.
Canadian Dollar Price Chart- USD/CAD Weekly
Chart Prepared by Michael Boutros, Sr. Technical Strategist; USD/CAD on TradingView
The most recent breakout in momentum was not only accompanied by a breach of key resistance near 1.4098-1.4115, but also an extreme build in short-exposure. Another clear reminder that extremes in momentum are often times the sharpest part of a trend despite the impulse of most retail traders to fade this condition. Remember that prices can stay in the overbought condition for an indefinite time period and it is ultimately, the return from overbought that typically marks the threat of a larger turnaround.
Ultimately, support and resistance remain fundamental pillars of technical analysis. While momentum and sentiment provide valuable context, they should always complement, not override, these core principles. Keep in mind that traders will ultimately tend to be most bearish at the highs and the threat of a price exhaustion is always more pronounced during times of extreme readings in sentiment.
Bottom line: The focus into the yearly cross is on a reaction into major technical resistance here at 1.4483-1.4538 – a region defined by the 1.618% extension of the July 2023 advance and the 2016 close high. Note that the upper parallel converges on this threshold over the next few weeks and further highlights the technical significance of this zone. Losses should be limited to 1.41 IF price is heading higher on this stretch with a close above this pivot zone needed to fuel the next leg of he advance towards 1.4660/90- look for a larger reaction there IF reached.
Written by Michael Boutros, Sr Technical Strategist
Follow Michael on X @MBForex


Open an account in minutes
Experience award-winning platforms with fast and secure execution, and enjoy tight spreads from 0.5 pts on FX and 0.3 pts on indices.
Economic calendar
Web Trader platform
Our sophisticated web-based platform is packed with features.
Related articles
Japanese Yen Forecast: USD/JPY 4% Rally Challenges Post-Intervention Downtrend 9 24 2026
USD/JPY momentum has shifted sharply higher, putting a major resistance confluence in focus as U.S. and Japanese event risk builds.

GBP/USD, DJIA Outlook: Support Levels Meet Oversold Risks
GBP/USD and the Dow test key support levels as rising Treasury yields, Fed rate-hike expectations and oversold momentum increase reversal risks.


USD/JPY outlook: Hawkish Fed recalibration pressures the yen
Stronger US growth momentum and rising Treasury yields are keeping USD/JPY pointed higher, even as Japanese policymakers try to limit the pressure building across domestic markets.

This report is intended for general circulation only. It should not be construed as a recommendation, or an offer (or solicitation of an offer) to buy or sell any financial products. The information provided does not take into account your specific investment objectives, financial situation or particular needs. Before you act on any recommendation that may be contained in this report, independent advice ought to be sought from a financial adviser regarding the suitability of the investment product, taking into account your specific investment objectives, financial situation or particular needs.
StoneX Financial Pte. Ltd., may distribute reports produced by its respective foreign entities or affiliates within the StoneX group of companies or third parties pursuant to an arrangement under Regulation 32C of the Financial Advisers Regulations. Where the report is distributed to a person in Singapore who is not an accredited investor, expert investor or an institutional investor (as defined in the Securities Futures Act), StoneX Financial Pte. Ltd. accepts legal responsibility to such persons for the contents of the report only to the extent required by law. Singapore recipients should contact StoneX Financial Pte. Ltd. at 6826 9988 for matters arising from, or in connection with the report.
In the case of all other recipients of this report, to the extent permitted by applicable laws and regulations neither StoneX Financial Pte. Ltd. nor its associated companies will be responsible or liable for any loss or damage incurred arising out of, or in connection with, any use of the information contained in this report and all such liability is hereby expressly disclaimed. No representation or warranty is made, express or implied, that the content of this report is complete or accurate.
StoneX Financial Pte. Ltd. is not under any obligation to update this report.
Trading CFDs carries a high level of risk that may not be suitable for some investors. Consider your investment objectives, level of experience, financial resources, risk appetite and other relevant circumstances carefully. The possibility exists that you could lose some or all of your investments, including your initial deposits. If in doubt, please seek independent expert advice. Visit www.forex.com/en-sg/terms-and-policies for the complete Risk Disclosure Statement.