




USD/JPY analysis: US dollar rally not over yet
Rising US import costs is inflationary, which is bad news for lower yielding currencies like JPY, even if the dollar has reacted negatively to news of retail sales missing the mark. The dollar bulls will not be too concerned yet.
Share this:

- USD/JPY analysis: Rising US import costs is inflationary – bad news for lower yielding currencies like JPY
- Retail sales missed but dollar bulls will not be too concerned
- USD/JPY technical analysis point to a major breakout
USD/JPY analysis video and insights on EUR/USD and gold
USD/JPY analysis: US dollar weakens as retail sales drop
The US dollar was already lower on the session and then fell further in response to the mixed data releases from the US, with retail sales looking particular weak. But I reckon it is far too early to talk about the top for the dollar, and a recovery for the greenback is likely given the long-term bullish trend and recent strong data releases from other sectors of the economy, plus a hawkish Federal Reserve. The soft retail sales figures could be an outlier after beating expectations in each of the previous six months. What’s more, import costs posted its largest gain in nearly two years in January, which could stop the disinflation process. The Fed won’t like that, and after a hot inflation report, they will be even more cautious. So, I reckon that the USD/JPY could rise back above 150.00 and break its two-year resistance just below the 152.00 handle, as a result.
The dollar’s slight weakness over the past couple of days has coincided with market pricing of rate cuts in 2024 rising back to around 100 basis points after falling to 90 bps following the hot CPI data. But with talks of an early rate cut in March effectively over and lots of questions marks over a May rate cut, this should help keep the dollar supported on the dips.
USD/JPY analysis: Rising import costs is inflationary
Signs of sticky inflation are everywhere. Rising costs of petroleum were among the reasons behind the sharp 0.8% monthly rise in import costs last month. This was the biggest rise since March 2022, although a revised 0.7% decline in the previous month from zero means the data is perhaps less alarming that the headline suggests. Still, the rise was not insignificant buy was unexpected. This comes hot on the heels of the CPI data showing price pressures came down less than expected last month. With inflationary pressures on the rise, yields could remain supported for longer, undermining lower yielding currencies like the yen and franc.
Today’s publication of jobless claims also beat, as too did the manufacturing indices of Philly and NY. But softer industrial production and retail sales meant the dollar would head lower, a move which, as I mentioned, is unlikely to be sustained. Headline retail sales fell 0.8% while core sales declined by 0.6%, both missing expectations. Industrial output declined 0.1% m/m.
Looking ahead, on Friday, we will have PPI, building permits, and UoM Consumer Sentiment.
USD/JPY technical analysis
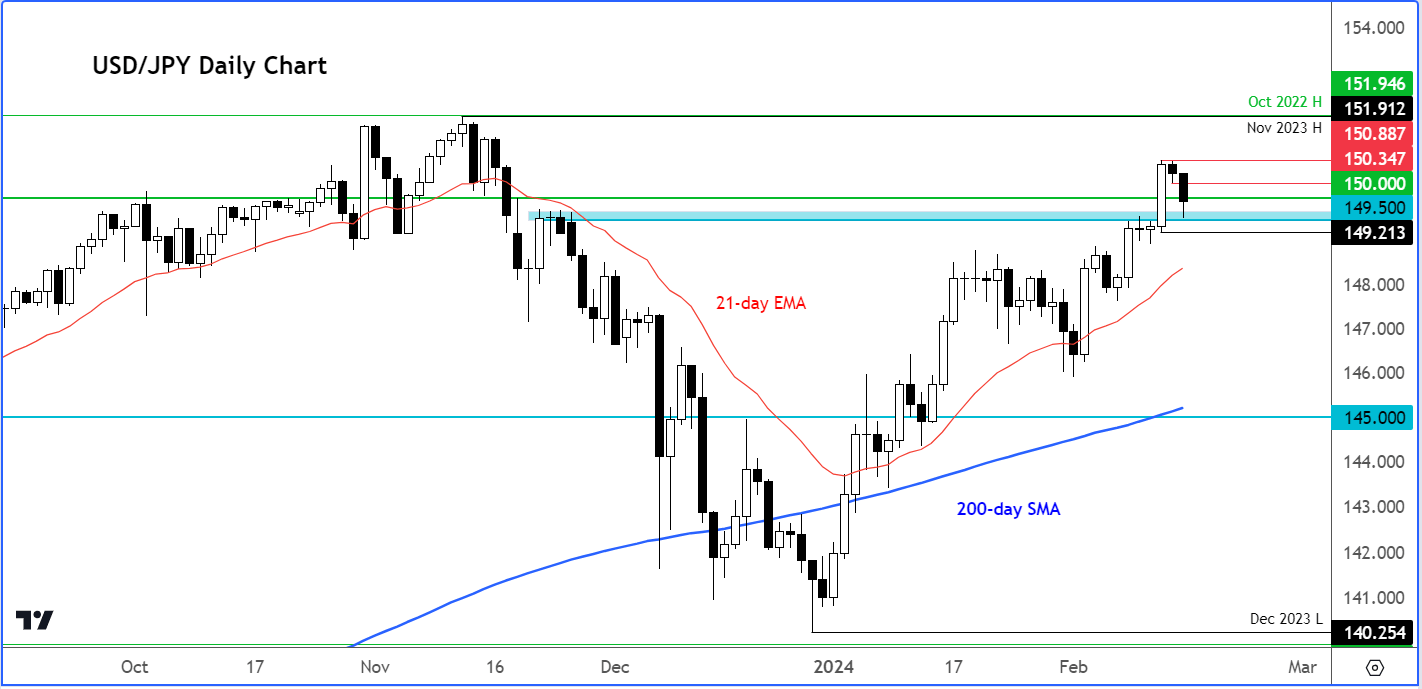
From a technical point of view, the USD/JPY is at a major pivotal area here.
The USD/JPY has faced challenges in maintaining a breakout above the 150.00 handle over the past few years, as evident from the weekly chart provided. However, a cup-and-handle continuation pattern suggests a potential breakout in the future.
In the immediate term, it's crucial for support to hold within the 150.00 to 149.50 range. This range, particularly the lower end, served as the starting point for this week's breakout, as depicted in the daily chart. The big thrust candle on Tuesday implies the possibility of further gains, but a prompt recovery is essential to prevent a loss of momentum.
Tuesday’s low at 149.21 is the line in the sand for me as far as the short-term is concerned. A breach of this level could trigger a rapid sell-off as resting stops below are activated.
However, if my base case scenario unfolds and we witness additional gains, my initial focus would be on reclaiming Wednesday's low at 150.35. Subsequently, the bulls’ attention may shift to liquidity above this week's high at 150.89, potentially paving the way for a surge towards the double top high around the 181.90-181.95 area, where the USD/JPY reached its peak in the past two years.
Source for all charts used in this article: TradingView.com
-- Written by Fawad Razaqzada, Market Analyst
Follow Fawad on Twitter @Trader_F_R
How to trade with City Index
You can trade with City Index by following these four easy steps:
- Open an account, or log in if you’re already a customer
• Open an account in the UK
• Open an account in Australia
• Open an account in Singapore
- Search for the company you want to trade in our award-winning platform
- Choose your position and size, and your stop and limit levels
- Place the trade
Related tags:


Open an account in minutes
Experience award-winning platforms with fast and secure execution, and enjoy tight spreads from 0.5 pts on FX and 0.3 pts on indices.
Economic calendar
Web Trader platform
Our sophisticated web-based platform is packed with features.
Related articles
Japanese Yen Forecast: USD/JPY 4% Rally Challenges Post-Intervention Downtrend 9 24 2026
USD/JPY momentum has shifted sharply higher, putting a major resistance confluence in focus as U.S. and Japanese event risk builds.

Oil Quietly Hands the Fed a Reason to Stay Hawkish
Oil prices and the U.S. dollar are both on the front foot as elevated energy costs feed Fed warnings that inflation may prove sticky.

USD/JPY outlook: Hawkish Fed recalibration pressures the yen
Stronger US growth momentum and rising Treasury yields are keeping USD/JPY pointed higher, even as Japanese policymakers try to limit the pressure building across domestic markets.

This report is intended for general circulation only. It should not be construed as a recommendation, or an offer (or solicitation of an offer) to buy or sell any financial products. The information provided does not take into account your specific investment objectives, financial situation or particular needs. Before you act on any recommendation that may be contained in this report, independent advice ought to be sought from a financial adviser regarding the suitability of the investment product, taking into account your specific investment objectives, financial situation or particular needs.
StoneX Financial Pte. Ltd., may distribute reports produced by its respective foreign entities or affiliates within the StoneX group of companies or third parties pursuant to an arrangement under Regulation 32C of the Financial Advisers Regulations. Where the report is distributed to a person in Singapore who is not an accredited investor, expert investor or an institutional investor (as defined in the Securities Futures Act), StoneX Financial Pte. Ltd. accepts legal responsibility to such persons for the contents of the report only to the extent required by law. Singapore recipients should contact StoneX Financial Pte. Ltd. at 6826 9988 for matters arising from, or in connection with the report.
In the case of all other recipients of this report, to the extent permitted by applicable laws and regulations neither StoneX Financial Pte. Ltd. nor its associated companies will be responsible or liable for any loss or damage incurred arising out of, or in connection with, any use of the information contained in this report and all such liability is hereby expressly disclaimed. No representation or warranty is made, express or implied, that the content of this report is complete or accurate.
StoneX Financial Pte. Ltd. is not under any obligation to update this report.
Trading CFDs carries a high level of risk that may not be suitable for some investors. Consider your investment objectives, level of experience, financial resources, risk appetite and other relevant circumstances carefully. The possibility exists that you could lose some or all of your investments, including your initial deposits. If in doubt, please seek independent expert advice. Visit www.forex.com/en-sg/terms-and-policies for the complete Risk Disclosure Statement.