



USD/JPY Price Outlook: Is the Rejection From 155 Sustainable?
USD/JPY Price Outlook: BOJ intervention concerns have pressured USD/JPY toward the 155 support zone—a defining level between a steep drawdown and a stable recovery. Key scenarios are now in focus.
Share this:

Uncertain headlines are ultimately quantified through price action—and in USD/JPY, this dynamic is now clearly visible. The pair’s recent rejection near the 155 support highlights a defining zone between a steep drawdown and a potential recovery, as institutional positioning adjusts to evolving macro risks.
Bank of Japan (BOJ) intervention concerns have pressured USD/JPY toward this key level, with the outlook shaped by a confluence of factors: Hormuz-driven inflation risks, sustained US dollar safe-haven demand, and shifting expectations around US monetary policy.
Should the BOJ step in, markets could once again experience a carry trade unwind, pressuring the US dollar while lifting global currency pairs and increasing volatility across forex markets.
USD/JPY Outlook: Key Drivers Shaping Price Action
- Rising import inflation: Hormuz disruptions and elevated energy costs are intensifying inflationary pressure in Japan, making prolonged yen weakness increasingly difficult to sustain.
- US dollar strength: Safe-haven demand continues to support the dollar, pushing USD/JPY higher and reinforcing one-sided speculative positioning near 160.
- Intervention risk near 160: This level remains politically sensitive, as Japanese officials previously intervened in 2024—triggering a sharp carry trade unwind.
- Policy shift potential: Authorities may intervene through direct yen buying or signal a more hawkish stance, including keeping rate hikes on the table.
- Liquidity risk: BOJ actions often occur during thin Asian trading hours, increasing the likelihood of sharp price spikes, stop-loss runs, and aggressive technical moves.
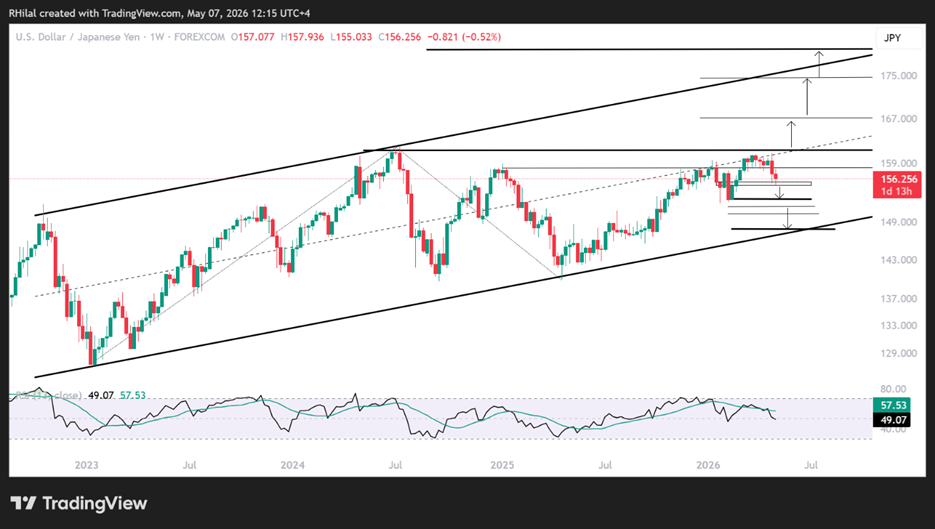
USDJPY Price Outlook: Weekly Time Frame – Log Scale
Source: Tradingview
To quantify uncertainty through price action, USD/JPY must be assessed across multiple time frames. On the weekly chart, the pair continues to respect a parallel uptrend established since April 2025, holding above the 155 support zone.
This structure is now testing the mid-zone resistance of a broader channel extending from the 2022 lows toward 2026—making this area a pivotal decision point for trend continuation or reversal.
Bullish Scenario: Continuation Above 160
A sustained break and weekly close above 158–160 would confirm renewed bullish momentum. In this scenario, price action could extend toward:
- 166
- 174
- 180
These levels align with Fibonacci projections (0.618, 0.786, 1.0, 1.272) of the broader cycle between the 127 low (2023), 161.70 high (2024), and 140 low (2025), while also coinciding with the upper boundary of the long-term ascending channel.
Bearish Scenario: Breakdown Below 155
Failure to reclaim 160, combined with sustained pressure below the channel mid-zone, increases the probability of a downside move. A confirmed break below 155 would signal a structural shift, opening the path toward:
- 152 (yearly lows)
- 150 (psychological level)
- 147 (channel support)
Such a move would reflect a deeper repositioning in USD/JPY, potentially driven by BOJ intervention or a broader shift in dollar sentiment.
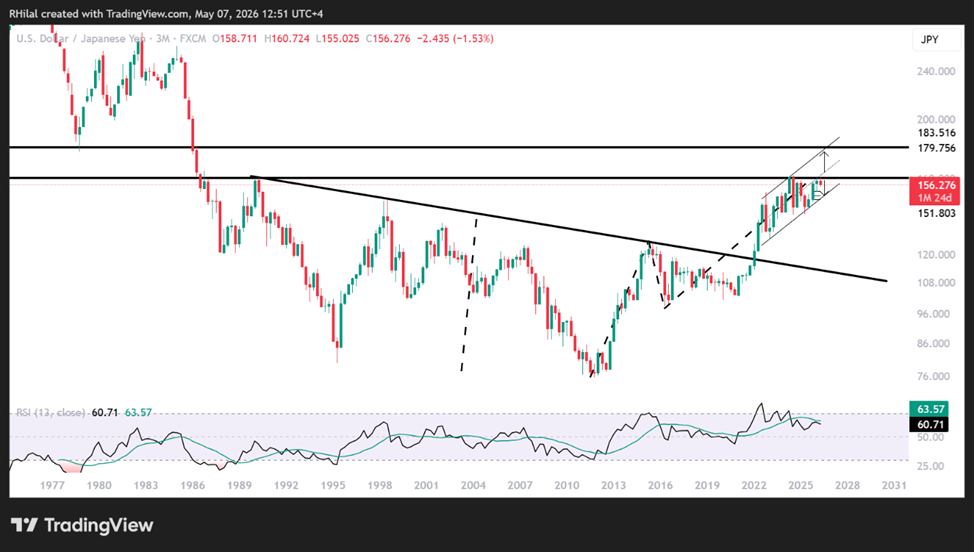
USD/JPY Forecast: 3-Month Time Frame Perspective
Source: TradingView
From a longer-term perspective, the 160 level remains a major historical resistance dating back to the 1990 highs. A confirmed breakout above this zone could unlock a structural rally toward the 180 region, revisiting levels last seen in the late 1970s and reinforcing the broader bullish trend.
On the downside, the 147 level, marking the lower boundary of the 2022–2026 channel, remains a critical support. A break below this level could accelerate losses toward the 140 and 130 ranges, potentially aligning with a broader US dollar index (DXY) breakdown below its long-term 2008–2026 uptrend
Final Thoughts: Price Action as a Measure of Market Truth
While macro headlines around BOJ intervention, inflation, and global risk sentiment continue to drive volatility, price action remains the most reliable measure of market positioning.
In USD/JPY, the reaction around 155 and 160 will define the next major trend—whether through continued dollar strength or a sharp reversal driven by policy intervention and a potential unwind in carry trades.
Written by Razan Hilal, CMT
Follow on X: @rh_waves


Open an account in minutes
Experience award-winning platforms with fast and secure execution, and enjoy tight spreads from 0.5 pts on FX and 0.3 pts on indices.
Economic calendar
Web Trader platform
Our sophisticated web-based platform is packed with features.
Related articles
Nikkei breakout accelerates as yen weakness returns
Nikkei has started October with a powerful breakout, helped by renewed yen weakness and strong upside momentum

AUD/USD hammered by US yields and fading RBA hike bets
US yields, dollar strength and fading RBA hike bets have combined to drive AUD/USD to fresh multi-month lows. The macro and technical bias remains bearish, although history suggests parts of the move are now reaching unusually stretched levels.

Japanese Yen Outlook: USD/JPY, GBP/JPY, AUD/JPY Setups
USD/JPY and GBP/JPY show signs of stabilising, while AUD/JPY remains vulnerable as yen crosses deliver mixed technical signals.

This report is intended for general circulation only. It should not be construed as a recommendation, or an offer (or solicitation of an offer) to buy or sell any financial products. The information provided does not take into account your specific investment objectives, financial situation or particular needs. Before you act on any recommendation that may be contained in this report, independent advice ought to be sought from a financial adviser regarding the suitability of the investment product, taking into account your specific investment objectives, financial situation or particular needs.
StoneX Financial Pte. Ltd., may distribute reports produced by its respective foreign entities or affiliates within the StoneX group of companies or third parties pursuant to an arrangement under Regulation 32C of the Financial Advisers Regulations. Where the report is distributed to a person in Singapore who is not an accredited investor, expert investor or an institutional investor (as defined in the Securities Futures Act), StoneX Financial Pte. Ltd. accepts legal responsibility to such persons for the contents of the report only to the extent required by law. Singapore recipients should contact StoneX Financial Pte. Ltd. at 6826 9988 for matters arising from, or in connection with the report.
In the case of all other recipients of this report, to the extent permitted by applicable laws and regulations neither StoneX Financial Pte. Ltd. nor its associated companies will be responsible or liable for any loss or damage incurred arising out of, or in connection with, any use of the information contained in this report and all such liability is hereby expressly disclaimed. No representation or warranty is made, express or implied, that the content of this report is complete or accurate.
StoneX Financial Pte. Ltd. is not under any obligation to update this report.
Trading CFDs carries a high level of risk that may not be suitable for some investors. Consider your investment objectives, level of experience, financial resources, risk appetite and other relevant circumstances carefully. The possibility exists that you could lose some or all of your investments, including your initial deposits. If in doubt, please seek independent expert advice. Visit www.forex.com/en-sg/terms-and-policies for the complete Risk Disclosure Statement.