



USDJPY and Nasdaq Challenge Defining Supports
USDJPY and the Nasdaq are testing critical support levels amid a near term rate-hold outlook, AI-related headwinds, and a broader risk-off tone across markets.
Share this:

Key Events
• Despite softer CPI and stronger NFP results, the Nasdaq has failed to build sustained bullish momentum, raising downside risks as dollar pairs remain supported by rate-hold expectations.
• AI-related concerns continue to limit bullish appetite across US indices, pressuring the Nasdaq below the 24,600 mark.
• USDJPY is attempting a rebound in line with the DXY’s hold above 97, yet key resistance levels remain a challenge.
CNN Fear and Greed Index
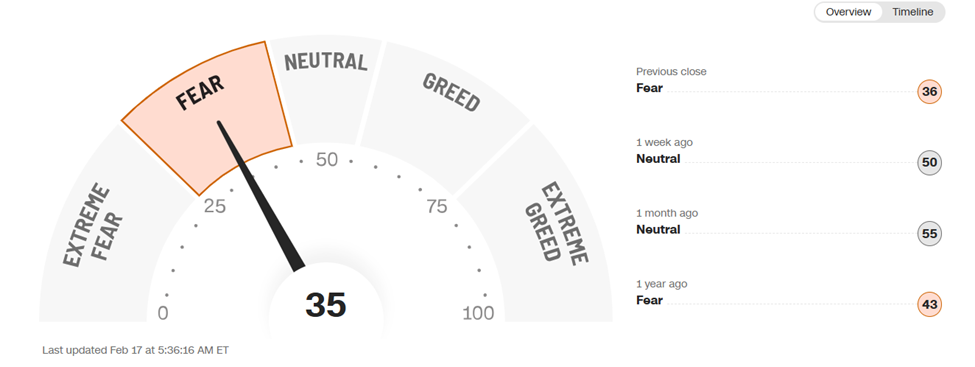
Although softer CPI and strong NFP data would typically support a constructive market tone, sentiment currently reflects fatigue and caution, particularly in the Nasdaq. The index has recorded multiple failed attempts to break above the 26,000 threshold since October 2025, leading to an extended consolidation phase.
This repeated pullback cycle has weighed on investor confidence, especially amid AI-sector turbulence and an uneasy political backdrop.

US economic data continues to show resilience. January NFP beat expectations with 130,000 jobs added, marking the strongest report since July 2025. Meanwhile, CPI eased toward levels last seen during that period, moving closer to the Federal Reserve’s target at 2.4%.
However, expectations for a rate hold over the coming months persist. Rate-cut sentiment begins to strengthen toward June, according to the CME FedWatch Tool, keeping markets in a cautious holding pattern.
While US indices, precious metals, and major currency pairs sit near critical support levels, dollar pairs are simultaneously approaching key resistance zones that must be cleared to confirm a sustainable bullish rebound.
Technical Analysis: Quantifying Uncertainty
USDJPY Outlook: Weekly Time Frame – Log Scale

Source: Tradingview
Relative to the April 2025 lows, USDJPY remains on a constructive uptrending support. However, when measured from the 2026 highs, the current move appears corrective in nature.
The 154.80–155 resistance zone stands as a decisive barrier before bullish territory can be reclaimed. A confirmed break above this area would reopen the path toward the upper bound of the ascending channel respected since the 2025 lows, exposing 157.80 and 158.80, and potentially the 160 zone — levels that could attract intervention risks due to currency stability concerns.
On the downside, the pair is testing the 152 support level for the third time. This area remains pivotal. A hold could redirect price higher, while a sustained break may extend losses toward 149.
Nasdaq Outlook: Weekly Time Frame – Log Scale

Source: Trading view
From a weekly perspective, the Nasdaq has recorded more than five pullbacks from the 26,000 threshold, increasing distribution risks ahead of a potential drawdown.
Support near 24,500 continues to hold, while resistance around 25,800 caps upside attempts. Momentum remains near the neutral 50 level from above, keeping the index at technical crossroads.
Bullish scenario:
A close back above 25,200 followed by a sustained break above 25,800 would shift the bias higher toward the 26,300 record high and potentially new thresholds beyond 27,000.
Bearish scenario:
A weekly close below 24,500 would expose 24,200, 23,900, and 22,900 as potential downside targets. These levels may attract dip-buying interest depending on momentum conditions.
The more extreme reset scenario — applicable not only to the Nasdaq but also to Nvidia, the Dow Jones, and the S&P 500 — would involve a retracement toward the former resistance zone defined by the December 2024 and February 2025 highs. For the Nasdaq, this area aligns near 22,200 and would represent a broader momentum reset.
Written by Razan Hilal, CMT
Follow on X: @Rh_waves
Related tags:
Latest market news




Open an account in minutes
Experience award-winning platforms with fast and secure execution, and enjoy tight spreads from 0.5 pts on FX and 0.3 pts on indices.
Economic calendar
Web Trader platform
Our sophisticated web-based platform is packed with features.
Related articles
EUR/USD Q4 2026 Outlook: Euro at a Crossroads as Fed, ECB Tighten 9 25 2026
EUR/USD enters Q4 at a pivotal inflection point as competing Fed-ECB policy paths and persistent inflation risks collide with major technical support.

Equity Indices Q4, 2026 Outlook: Cracks Begin to Show
There's still an open door for a melt-up in the S&P 500 and Nasdaq but the Dow and Russell 2000 are looking more vulnerable, and until calm hits the Treasuries market there's a higher probability for volatility. The big question is whether that's a next quarter theme or not.

AUD/USD Q4 Outlook: RBA and Fed Hikes Set the Tone
AUD/USD enters Q4 with RBA and Fed hikes in focus as sticky inflation, rising unemployment and US dollar strength shape the Australian dollar.

This report is intended for general circulation only. It should not be construed as a recommendation, or an offer (or solicitation of an offer) to buy or sell any financial products. The information provided does not take into account your specific investment objectives, financial situation or particular needs. Before you act on any recommendation that may be contained in this report, independent advice ought to be sought from a financial adviser regarding the suitability of the investment product, taking into account your specific investment objectives, financial situation or particular needs.
StoneX Financial Pte. Ltd., may distribute reports produced by its respective foreign entities or affiliates within the StoneX group of companies or third parties pursuant to an arrangement under Regulation 32C of the Financial Advisers Regulations. Where the report is distributed to a person in Singapore who is not an accredited investor, expert investor or an institutional investor (as defined in the Securities Futures Act), StoneX Financial Pte. Ltd. accepts legal responsibility to such persons for the contents of the report only to the extent required by law. Singapore recipients should contact StoneX Financial Pte. Ltd. at 6826 9988 for matters arising from, or in connection with the report.
In the case of all other recipients of this report, to the extent permitted by applicable laws and regulations neither StoneX Financial Pte. Ltd. nor its associated companies will be responsible or liable for any loss or damage incurred arising out of, or in connection with, any use of the information contained in this report and all such liability is hereby expressly disclaimed. No representation or warranty is made, express or implied, that the content of this report is complete or accurate.
StoneX Financial Pte. Ltd. is not under any obligation to update this report.
Trading CFDs carries a high level of risk that may not be suitable for some investors. Consider your investment objectives, level of experience, financial resources, risk appetite and other relevant circumstances carefully. The possibility exists that you could lose some or all of your investments, including your initial deposits. If in doubt, please seek independent expert advice. Visit www.forex.com/en-sg/terms-and-policies for the complete Risk Disclosure Statement.