





USDJPY Leaves Blood on the Street Heading into Halloween Night
When stocks get killed, so does USD/JPY
Share this:

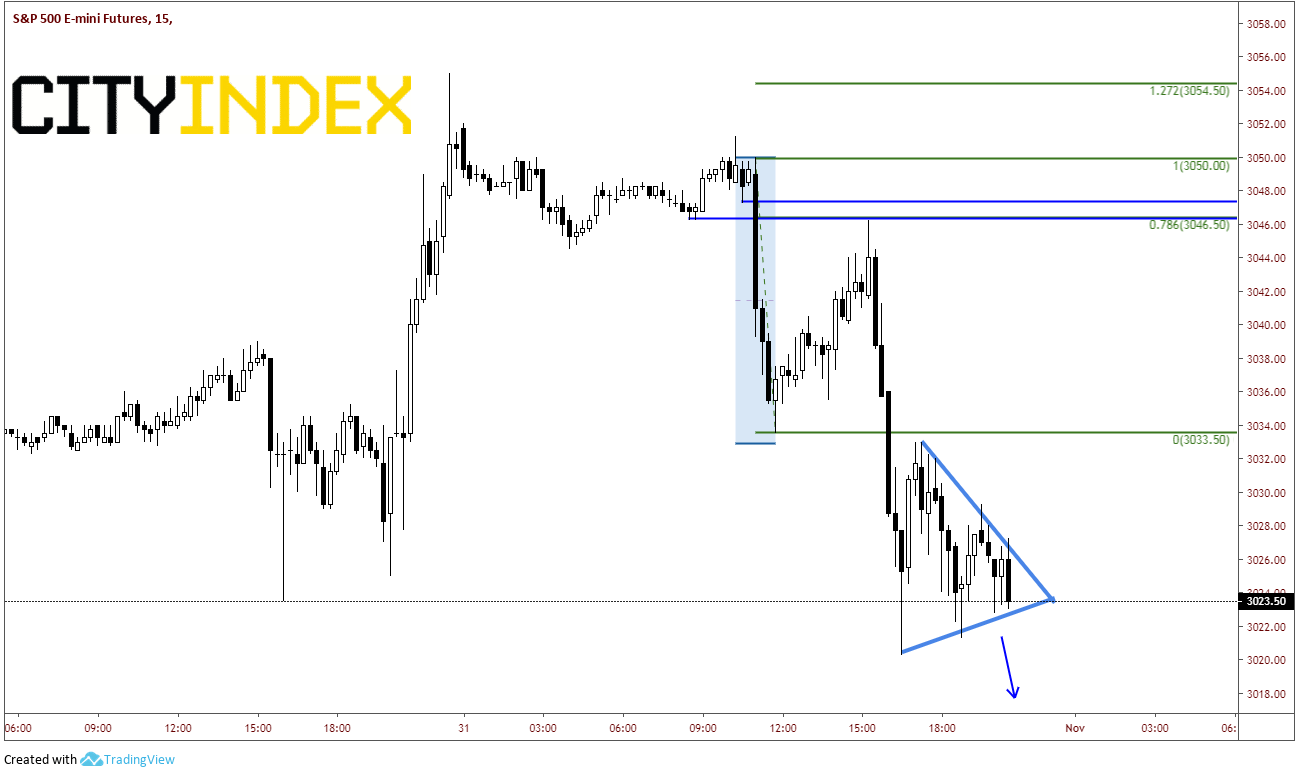
As we discussed earlier on the week, USD/JPY and stocks are highly correlated. As stocks scream higher, so does USD/JPY. The same is true for the reverse. When stocks get killed, so does USD/JPY. With Halloween (coincidentally) on October 31st in the US, its no surprise to see sharp moves into the close, as large funds often need to rebalance their portfolios into month end. Stock longs appear to be scared to death and running for the exits into the Halloween night.
Source: Tradingview, CME, City Index
As such, USD/JPY is getting slaughtered itself, off almost 100 pips from today’s highs and slicing through support like a knife through…well, you know. Yesterday’s shooting star formation on a daily time frame should have cautioned USD/JPY longs as it reversed right at the 61.8% Fibonacci retracement level from the highs on April 23rd to the lows on August 26th. The pair is close to testing its recent breakout of the downward sloping trendline from May 3rd, near 107.75.
Source: Tradingview, City Index
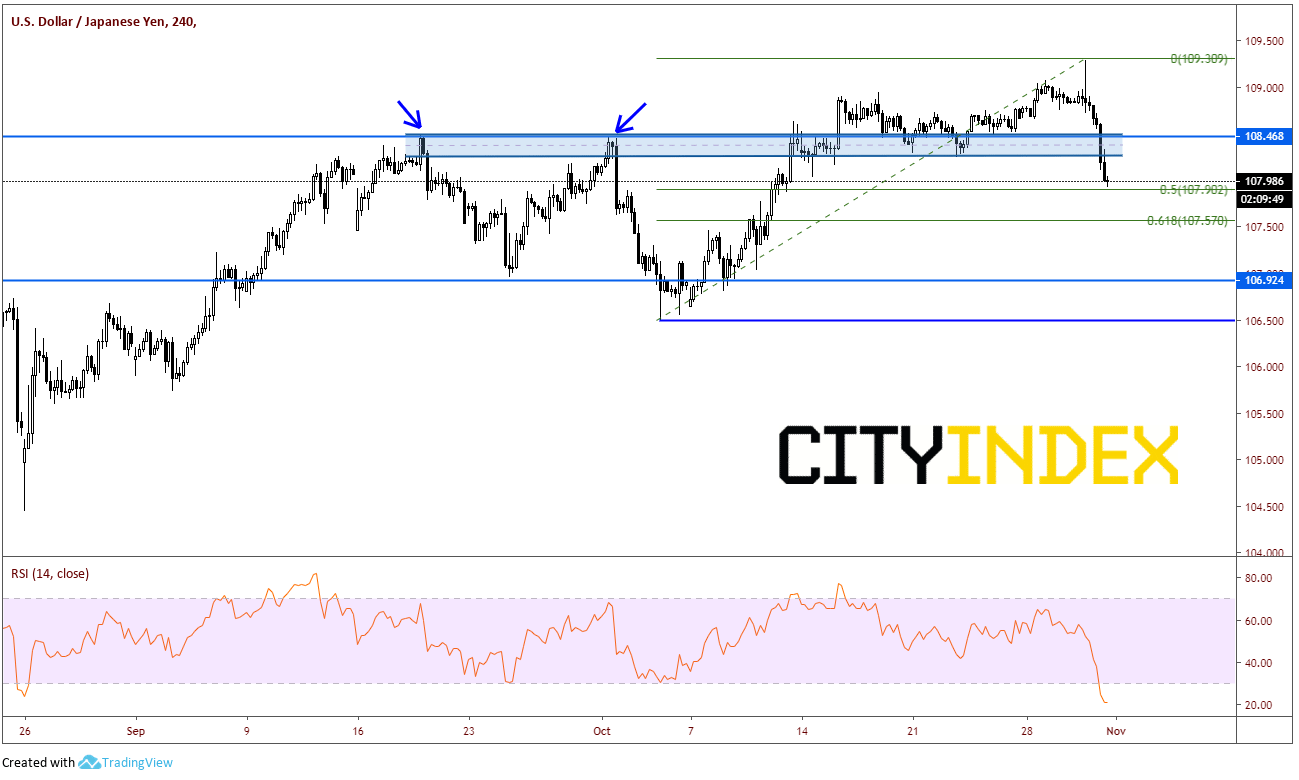
On a 240-minute chart, one can see how USD/JPY didn’t even pause at a strong support zone between 108.25 and 108.50. However, the pair did stall at the 50% retracement from the low on October 3rd to the high at 109.30, which is 109.90. The trendline support mentioned on the daily chart at 107.75 is the next level of support. The 61.8% retracement of the same time period is at 107.57, which is also near the upward sloping trendline on the daily. Below that, USD/JPY could slice through the neckline of the double top pattern at 106.92 and drop to the lows from October 3rd at 106.50! Caution the oversold RSI, which may need to unwind if the pair decides to move lower. Resistance is above at the 108.25/50 level, and then todays highs at 109.28.
Source: Tradingview, City Index
But tomorrow is a new day. And those that have survived the night will be around for Non-Farm Payroll data in the morning. For those still around today and participating, have a Happy Halloween.
As we discussed earlier on the week, USD/JPY and stocks are highly correlated. As stocks scream higher, so does USD/JPY. The same is true for the reverse. When stocks get killed, so does USD/JPY. With Halloween (coincidentally) on October 31st in the US, its no surprise to see sharp moves into the close, as large funds often need to rebalance their portfolios into month end. Stock longs appear to be scared to death and running for the exits into the Halloween night.
Source: Tradingview, CME, FOREX.com
As such, USD/JPY is getting slaughtered itself, off almost 100 pips from today’s highs and slicing through support like a knife through…well, you know. Yesterday’s shooting star formation on a daily time frame should have cautioned USD/JPY longs as it reversed right at the 61.8% Fibonacci retracement level from the highs on April 23rd to the lows on August 26th. The pair is close to testing its recent breakout of the downward sloping trendline from May 3rd, near 107.75.
Source: Tradingview, FOREX.com
On a 240-minute chart, one can see how USD/JPY didn’t even pause at a strong support zone between 108.25 and 108.50. However, the pair did stall at the 50% retracement from the low on October 3rd to the high at 109.30, which is 109.90. The trendline support mentioned on the daily chart at 107.75 is the next level of support. The 61.8% retracement of the same time period is at 107.57, which is also near the upward sloping trendline on the daily. Below that, USD/JPY could slice through the neckline of the double top pattern at 106.92 and drop to the lows from October 3rd at 106.50! Caution the oversold RSI, which may need to unwind if the pair decides to move lower. Resistance is above at the 108.25/50 level, and then todays highs at 109.28.
Source: Tradingview, FOREX.com
But tomorrow is a new day. And those that have survived the night will be around for Non-Farm Payroll data in the morning. For those still around today and participating, have a Happy Halloween.


Open an account in minutes
Experience award-winning platforms with fast and secure execution, and enjoy tight spreads from 0.5 pts on FX and 0.3 pts on indices.
Economic calendar
Web Trader platform
Our sophisticated web-based platform is packed with features.
Related articles
Nikkei breakout accelerates as yen weakness returns
Nikkei has started October with a powerful breakout, helped by renewed yen weakness and strong upside momentum

AUD/USD hammered by US yields and fading RBA hike bets
US yields, dollar strength and fading RBA hike bets have combined to drive AUD/USD to fresh multi-month lows. The macro and technical bias remains bearish, although history suggests parts of the move are now reaching unusually stretched levels.

Japanese Yen Outlook: USD/JPY, GBP/JPY, AUD/JPY Setups
USD/JPY and GBP/JPY show signs of stabilising, while AUD/JPY remains vulnerable as yen crosses deliver mixed technical signals.

This report is intended for general circulation only. It should not be construed as a recommendation, or an offer (or solicitation of an offer) to buy or sell any financial products. The information provided does not take into account your specific investment objectives, financial situation or particular needs. Before you act on any recommendation that may be contained in this report, independent advice ought to be sought from a financial adviser regarding the suitability of the investment product, taking into account your specific investment objectives, financial situation or particular needs.
StoneX Financial Pte. Ltd., may distribute reports produced by its respective foreign entities or affiliates within the StoneX group of companies or third parties pursuant to an arrangement under Regulation 32C of the Financial Advisers Regulations. Where the report is distributed to a person in Singapore who is not an accredited investor, expert investor or an institutional investor (as defined in the Securities Futures Act), StoneX Financial Pte. Ltd. accepts legal responsibility to such persons for the contents of the report only to the extent required by law. Singapore recipients should contact StoneX Financial Pte. Ltd. at 6826 9988 for matters arising from, or in connection with the report.
In the case of all other recipients of this report, to the extent permitted by applicable laws and regulations neither StoneX Financial Pte. Ltd. nor its associated companies will be responsible or liable for any loss or damage incurred arising out of, or in connection with, any use of the information contained in this report and all such liability is hereby expressly disclaimed. No representation or warranty is made, express or implied, that the content of this report is complete or accurate.
StoneX Financial Pte. Ltd. is not under any obligation to update this report.
Trading CFDs carries a high level of risk that may not be suitable for some investors. Consider your investment objectives, level of experience, financial resources, risk appetite and other relevant circumstances carefully. The possibility exists that you could lose some or all of your investments, including your initial deposits. If in doubt, please seek independent expert advice. Visit www.forex.com/en-sg/terms-and-policies for the complete Risk Disclosure Statement.