



Weekly Equities Outlook: Occidental Petroleum, Johnson and Johnson, Nike
With no signs of de-escalation in the Middle East, oil exposure and defensive positioning are in focus. Nike will also release Q3 earnings.
Share this:

Occidental Petroleum – oil exposure
Oil prices remain a key focus for markets amid ongoing uncertainty over the outlook for the war in Iran.
Conflicting signals over how close the US and Iran may be to any meaningful de-escalation have kept crude prices elevated, with Brent holding above $100 a barrel. As a result, energy stocks continue to find support.
Occidental Petroleum rose 8% last week to $64 a share as elevated oil prices improved confidence in earnings across upstream producers and prompted investors to rotate into names with greater direct exposure to crude.
Sector peers ExxonMobil and Chevron also moved higher. However, unlike more diversified integrated majors such as Exxon and Chevron, Occidental has greater sensitivity to oil prices due to its heavier exposure to upstream production and its more leveraged balance sheet.
That makes Occidental’s earnings and cash flow more directly tied to sustained strength in crude prices.
At the same time, President Trump’s decision to send an additional 10,000 troops to the Middle East has reinforced market scepticism over how quickly the conflict may be resolved.
As long as geopolitical tensions remain elevated and oil prices stay firm, Occidental Petroleum could continue to outperform.
How to trade OXY?
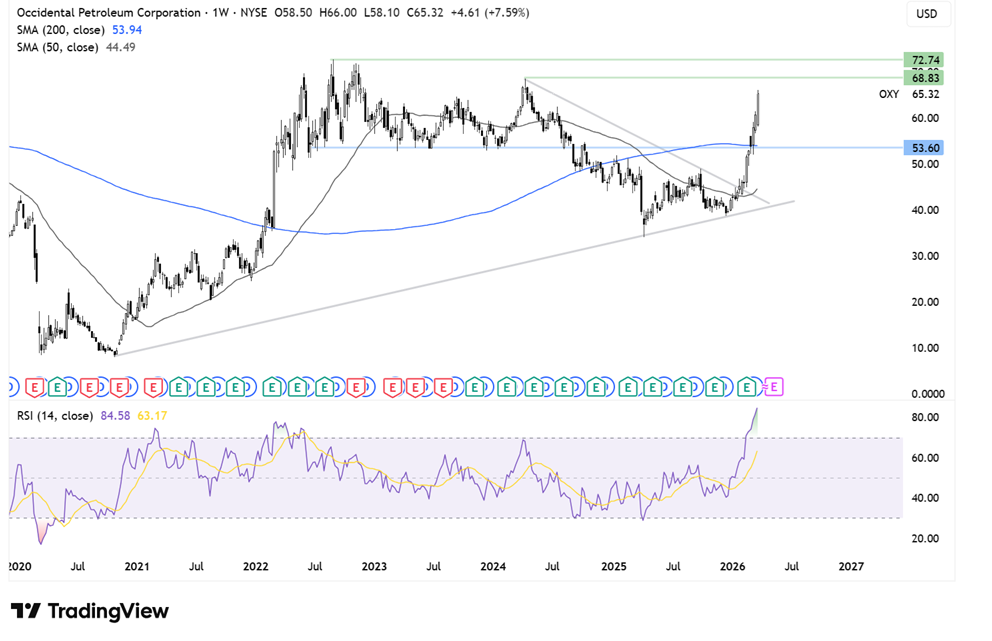
OXY share price broke out of the symmetrical triangle of the weekly chart, rising above the 200 SMA to a peak of 66.00. The RSI is very overbought, so some consolidation could be on the cards before further gains. Buyers will look to rise towards 68.80, the 2024 high, ahead of 72.75, the 2022 high. Support is seen at 54.00, the 200 SMA and the 2023 low.

Johnson & Johnson – defensive stock
US stock indices fell again last week, the S&P 500 dropped 2.1%, its fifth straight weekly decline amid a high-risk off-market mood. Traders are looking for more resilient areas of the market amid heightened geopolitical uncertainty, elevated oil prices, and concerns over slowing global growth.
Unlike more cyclical sectors, healthcare tends to be less sensitive to swings in economic activity, making Johnson & Johnson relatively well-positioned during this current period of market stress. The company benefits from a diversified business model across pharmaceuticals and medical technology, which helps support more stable revenues and earnings even when broader risk sentiment deteriorates.
In the current environment — where higher energy prices are raising inflation concerns and pushing treasury yields higher (10-year treasury yield has risen to 4.5%, a 1-year high) — investors are increasingly rotating towards companies with strong balance sheets, predictable cash flows, and defensive earnings profiles.
Johnson & Johnson fits that profile well. As long as macro uncertainty remains elevated and markets stay cautious, the stock could continue to attract defensive inflows and outperform the broader market.
How to trade JNJ?
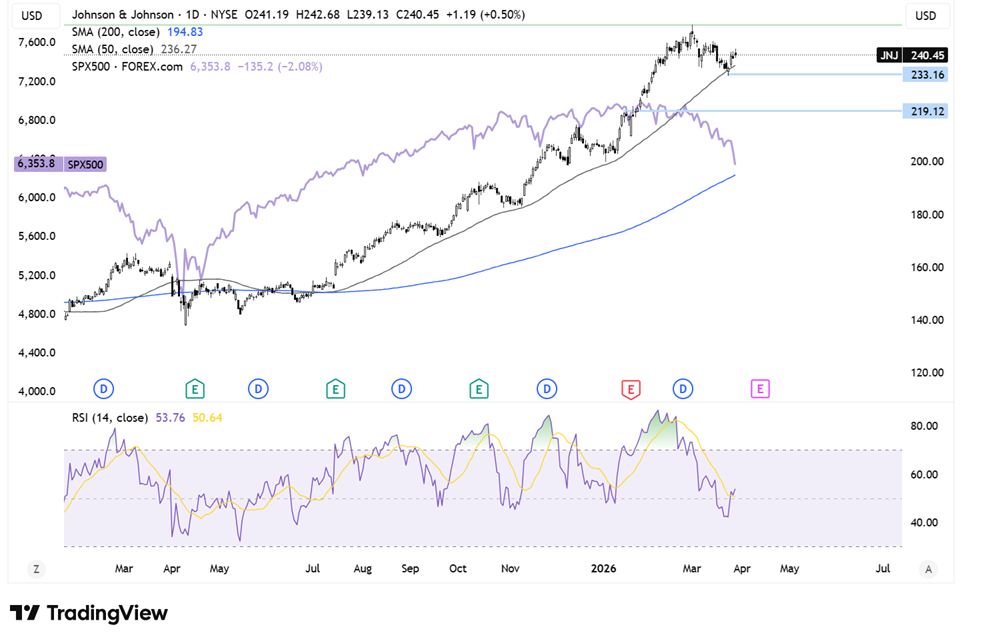
Johnson & Johnson share price traded higher from the April low, running into resistance at 250, the record high. The price has since eased lower but continues to find support from the 50 SMA. The chart highlights the divergence from the S&P 500 in recent weeks. While the 50 SMA holds, buyers will look to rise back up to 250.
Nike Q3 earnings preview
Nike will release third-quarter earnings on Tuesday after the market close. The sportswear giant is expected to post EPS of $0.28 per share, down 48% year-on-year, while revenue is forecast to decline 1% to $11.2 billion.
Gross margins are expected to come in at 39.8%, down from 40.6% in Q2.
Guidance will be a key focus, with Q4 EPS expected at $0.21 per share, representing growth of around 53.4%, while revenue is projected to rise 2% to $11.3 billion.
Earnings come amid ongoing restructuring efforts, as CEO Elliot Hill shifts focus back to wholesale and amid intense competition from brands like Hoka and On. The business is also experiencing high tariff-related costs, which are expected to add $1.5 billion in expenses and hit margins. China, a key market, remains under pressure. North American sales could indicate potential progress in the turnaround.
The share price continues to hover around $53 — levels last seen in 2017 — suggesting the market remains unconvinced about Nike’s turnaround.
The stock is down 18% in 2026 alone and around 56% over the past three years, even as the business shows early signs of stabilisation.
The footwear and sportswear giant continues to face intense competition and a challenging macroeconomic environment, which is weighing on discretionary spending.
How to trade NKE?
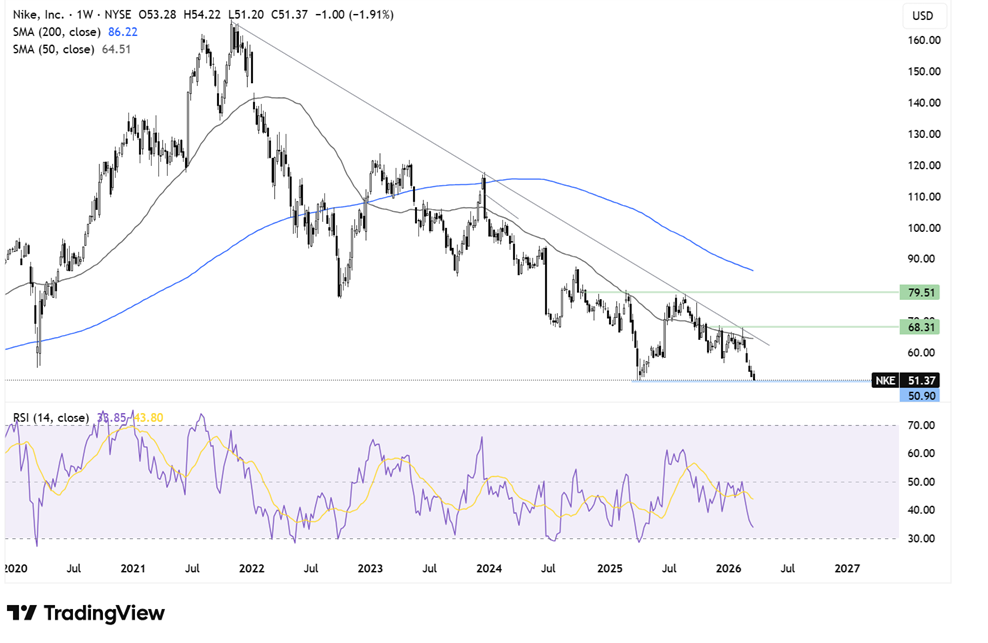
On the weekly chart, NKE has trended lower from the 166 November 2021 high, trading below its falling trendline to 51.30 at the end of last week, the April 2025 low and 2017 low. Sellers supported by the RSI below 50 will look to break below here and head towards 50.90, the 2016 low.
Any recovery must rise above 64.50, the 50 SMA and 68.30, the 2026 high. Above here 79.50 comes into play, the 2025 high.
Related tags:
Latest market news




Open an account in minutes
Experience award-winning platforms with fast and secure execution, and enjoy tight spreads from 0.5 pts on FX and 0.3 pts on indices.
Economic calendar
Web Trader platform
Our sophisticated web-based platform is packed with features.
Related articles

S&P 500, Nasdaq, Dow Forecast: Wall Street Split Widens Into Month-End 9 26 2026
Nasdaq strength contrasts with mounting Dow pressure as rising Treasury yields raise the stakes for stocks heading into the monthly close.


Weekly Equities Outlook: Nike, Micron Technology, Carnival Corp.
Earnings from Nike comes as the share price trades at a 12-year low. Micron Technology keeps the AI trade in focus and Carnival suffers from rising fuel costs.

Weekly Equities Forecast: Costco, JD Sports & Strategy
Earnings Costco, JD Sports report earnings and crypto stocks are in focus with after Friday's SEC announcement which boosted BTC.
This report is intended for general circulation only. It should not be construed as a recommendation, or an offer (or solicitation of an offer) to buy or sell any financial products. The information provided does not take into account your specific investment objectives, financial situation or particular needs. Before you act on any recommendation that may be contained in this report, independent advice ought to be sought from a financial adviser regarding the suitability of the investment product, taking into account your specific investment objectives, financial situation or particular needs.
StoneX Financial Pte. Ltd., may distribute reports produced by its respective foreign entities or affiliates within the StoneX group of companies or third parties pursuant to an arrangement under Regulation 32C of the Financial Advisers Regulations. Where the report is distributed to a person in Singapore who is not an accredited investor, expert investor or an institutional investor (as defined in the Securities Futures Act), StoneX Financial Pte. Ltd. accepts legal responsibility to such persons for the contents of the report only to the extent required by law. Singapore recipients should contact StoneX Financial Pte. Ltd. at 6826 9988 for matters arising from, or in connection with the report.
In the case of all other recipients of this report, to the extent permitted by applicable laws and regulations neither StoneX Financial Pte. Ltd. nor its associated companies will be responsible or liable for any loss or damage incurred arising out of, or in connection with, any use of the information contained in this report and all such liability is hereby expressly disclaimed. No representation or warranty is made, express or implied, that the content of this report is complete or accurate.
StoneX Financial Pte. Ltd. is not under any obligation to update this report.
Trading CFDs carries a high level of risk that may not be suitable for some investors. Consider your investment objectives, level of experience, financial resources, risk appetite and other relevant circumstances carefully. The possibility exists that you could lose some or all of your investments, including your initial deposits. If in doubt, please seek independent expert advice. Visit www.forex.com/en-sg/terms-and-policies for the complete Risk Disclosure Statement.