



Whats Up with USDCAD
Why is USD/CAD so bid over the last 2-days? OIL!
Share this:

Stocks markets have seen a great deal of volatility over that two days. Stocks are down roughly 90 to 100 handles and the VIX is up about 5.00. DXY has been getting crushed as well, down about 40 pips over the 2-day period. These moves have been blamed on the poor ISM Manufacturing data yesterday and the downward revision to the ADP data out this morning (which in turn, is forecasting a worse than expected Nonfarm Payroll number of Friday).
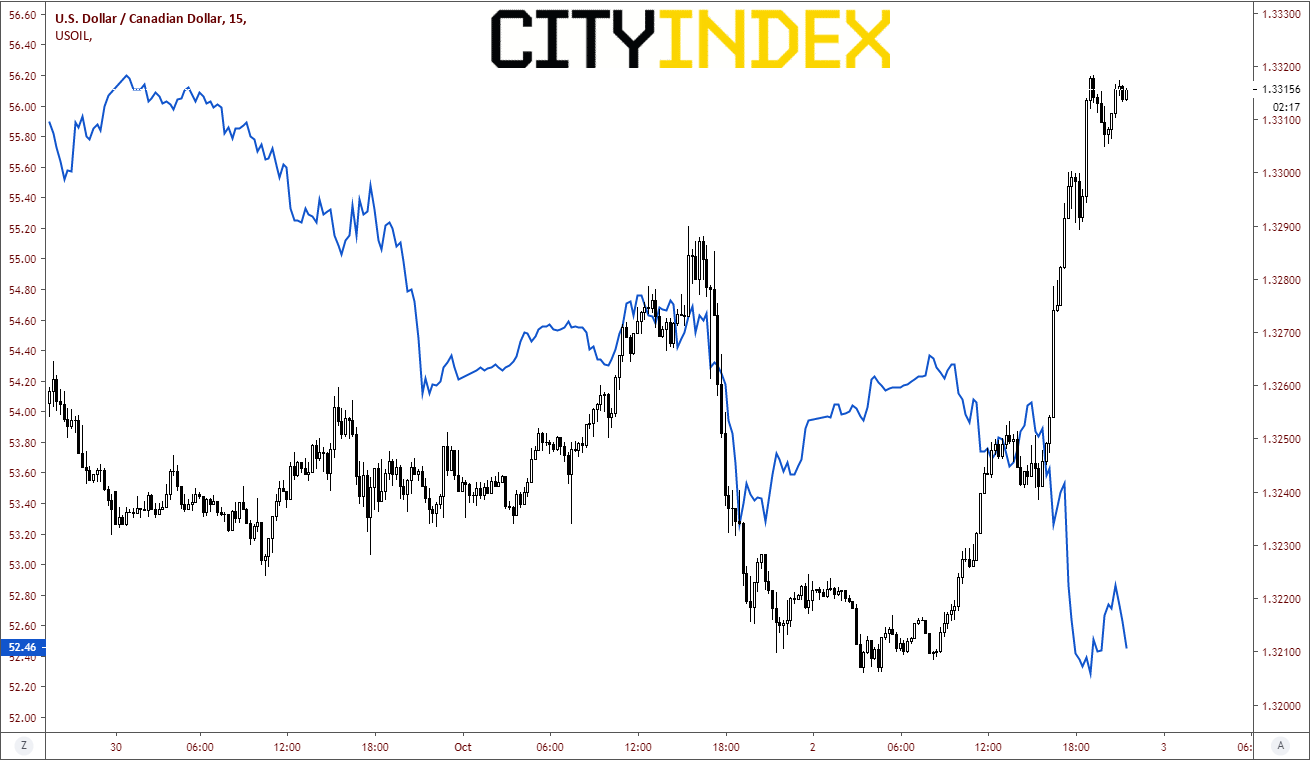
If the US Dollar has been hit so hard over the last few days, then why is USD/CAD so bid over the last 2-days? OIL! The Canadian Dollar and the price of oil move together, that is, USD/CAD and WTI are inversely related. Moving lower along with stocks and the US Dollar has been the price of West Texas Oil (blue line), which is down about 3% over the past couple of days. Therefore, the price of USD/CAD has been moving higher.
Source: Tradingview, City Index
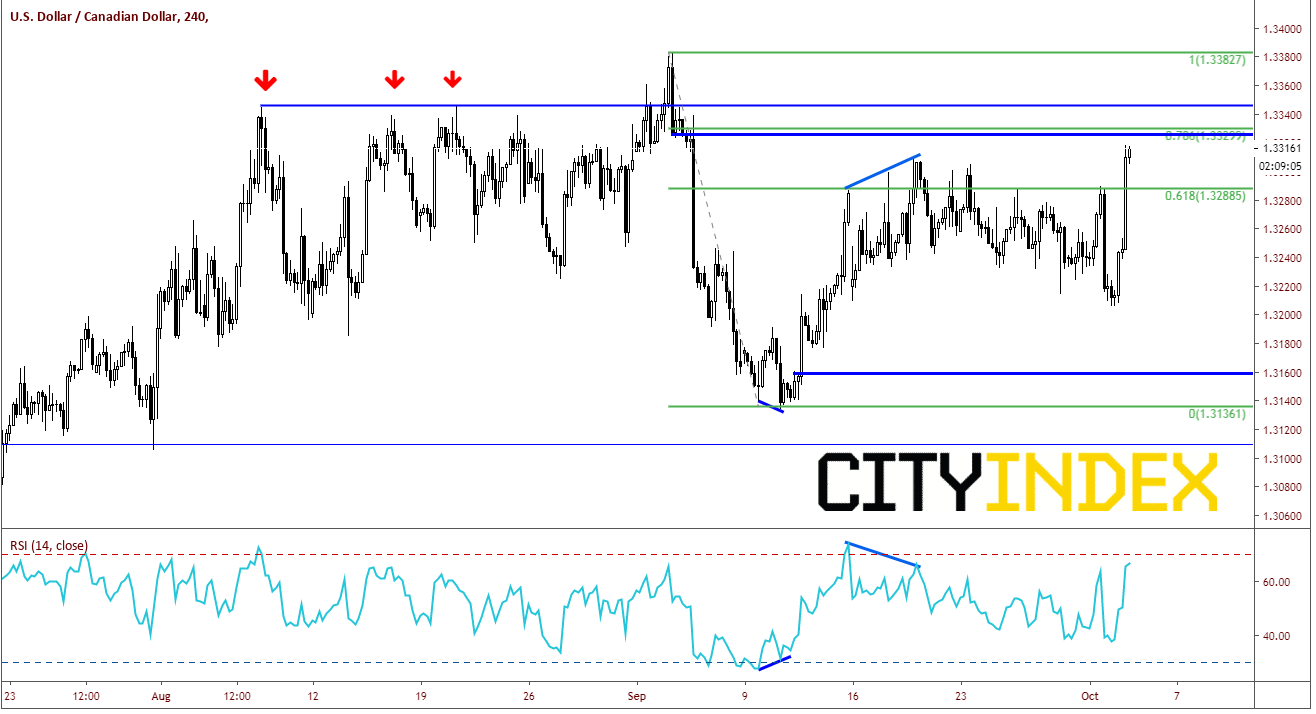
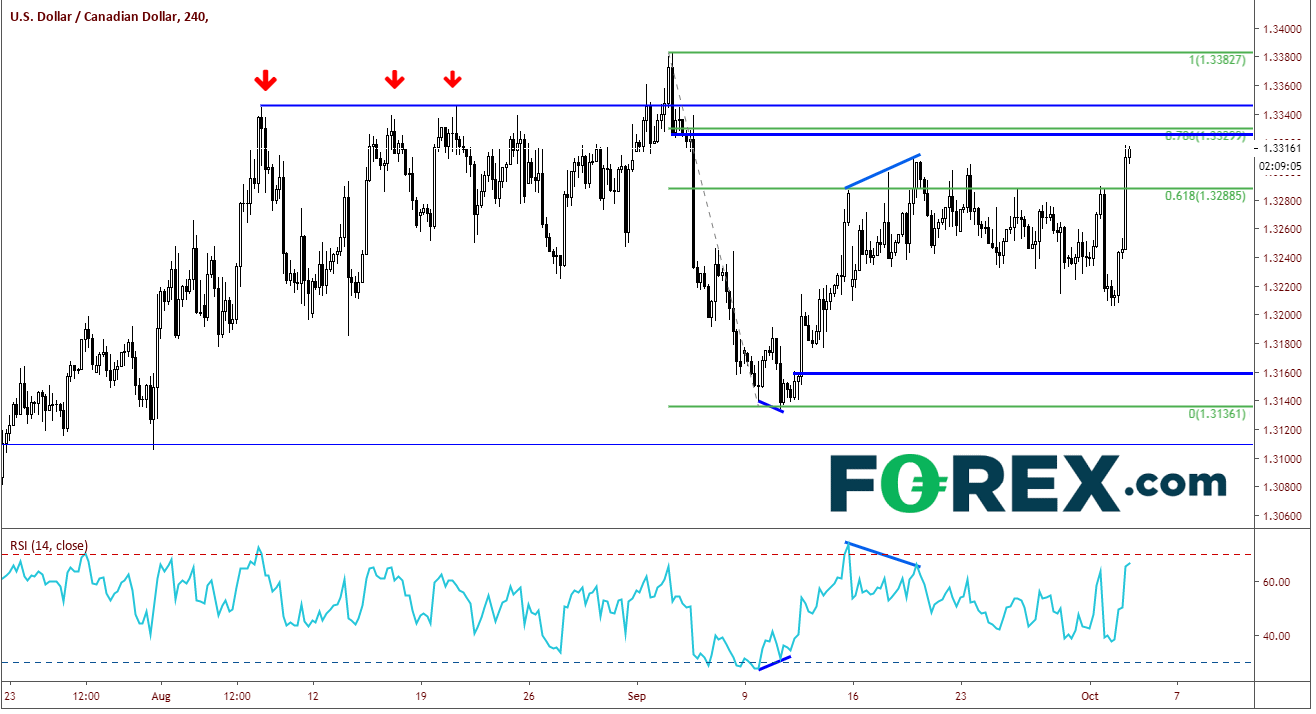
USD/CAD took off today, up almost 100 pips, just ahead of strong horizontal resistance at 1.3320 and the 78.6% retracement level from the highs on September 4th to the lows on September 10th at 1.3230. First support comes in at 1.3288. Below that are the previously mentioned lows from September 10th.
Source: Tradingview, City Index
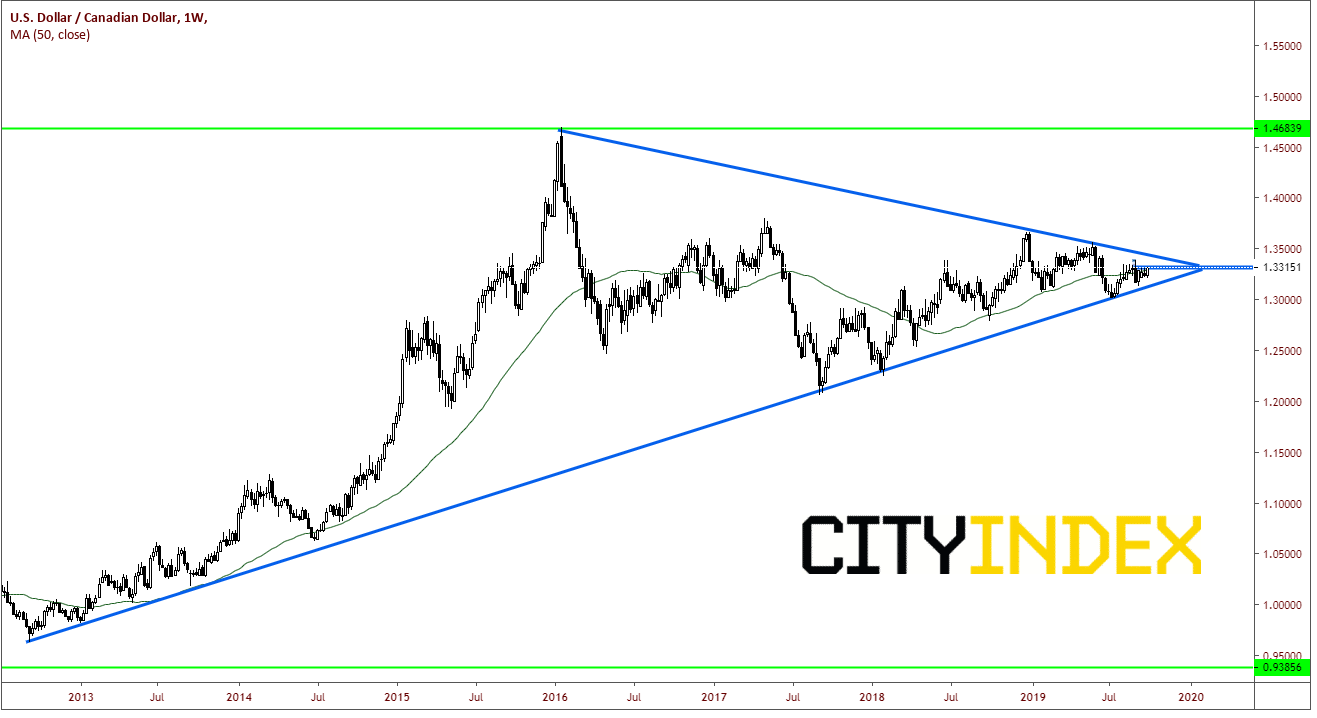
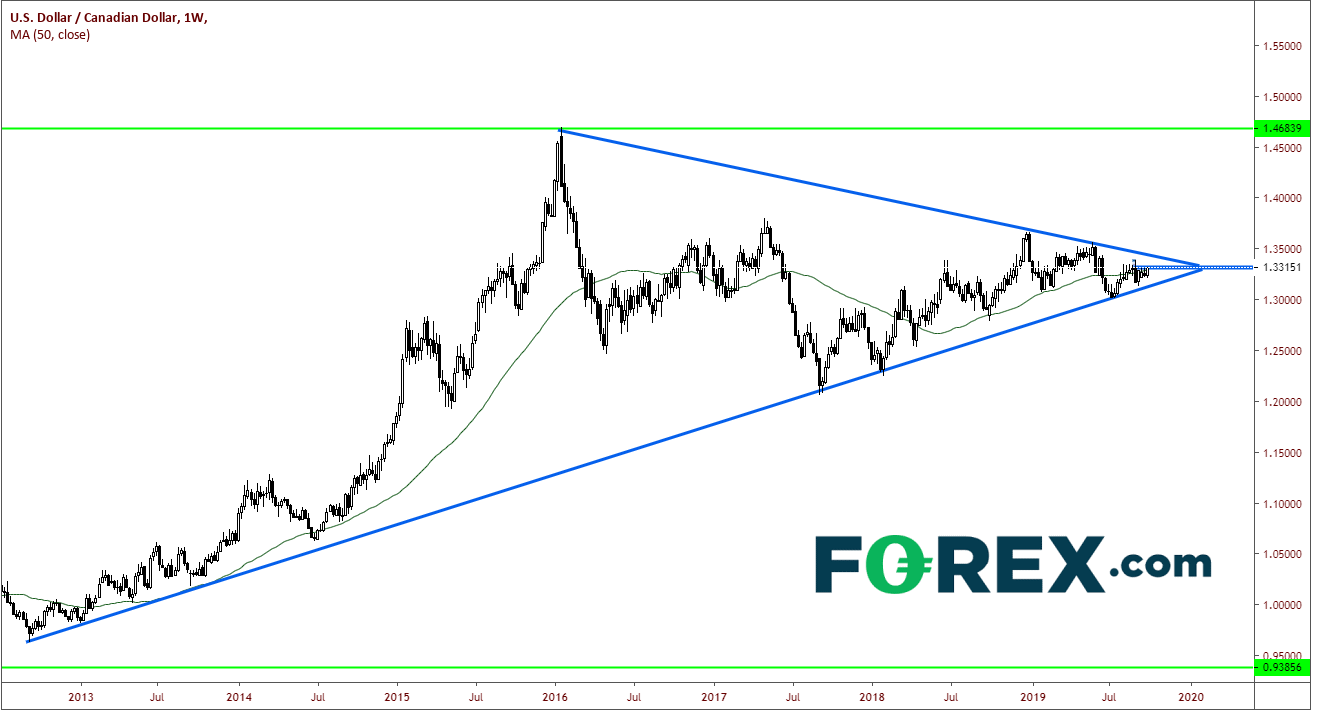
However, PAY ATTENTION TO THE WEEKLY CHART! USD/CAD IS wound up tightly inside this symmetric triangle on the weekly chart. The downward sloping trendline comes in at roughly 1.3435. The upward sloping trendline comes in at roughly 1.3135. THE BREAK OF EITHER OF THESE TRENDLINES MAY DETERMINE THE NEXT LONGTERM DIRECTION OF USD/CAD.
Source: Tradingview, City Index
Stocks markets have seen a great deal of volatility over that two days. Stocks are down roughly 90 to 100 handles and the VIX is up about 5.00. DXY has been getting crushed as well, down about 40 pips over the 2-day period. These moves have been blamed on the poor ISM Manufacturing data yesterday and the downward revision to the ADP data out this morning (which in turn, is forecasting a worse than expected Nonfarm Payroll number of Friday).
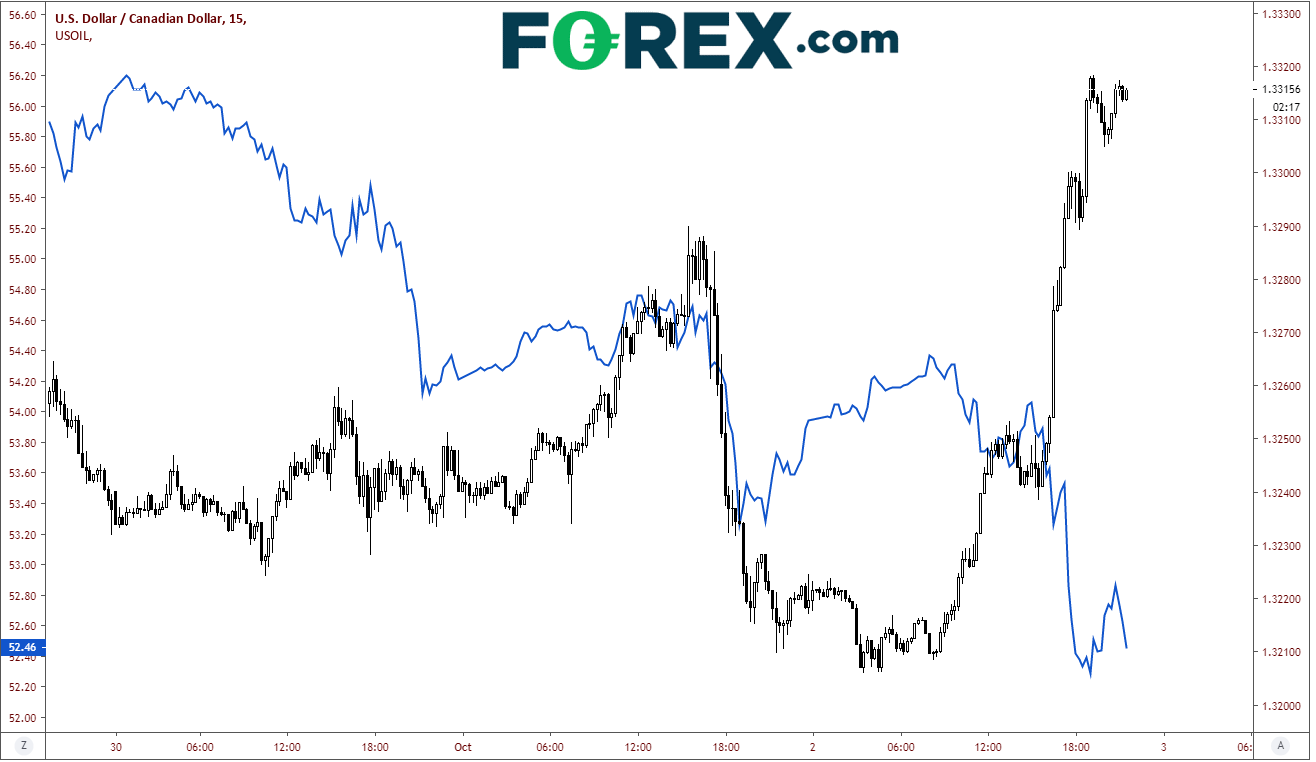
If the US Dollar has been hit so hard over the last few days, then why is USD/CAD so bid over the last 2-days? OIL! The Canadian Dollar and the price of oil move together, that is, USD/CAD and WTI are inversely related. Moving lower along with stocks and the US Dollar has been the price of West Texas Oil (blue line), which is down about 3% over the past couple of days. Therefore, the price of USD/CAD has been moving higher.
Source: Tradingview, FOREX.com
USD/CAD took off today, up almost 100 pips, just ahead of strong horizontal resistance at 1.3320 and the 78.6% retracement level from the highs on September 4th to the lows on September 10th at 1.3230. First support comes in at 1.3288. Below that are the previously mentioned lows from September 10th.
Source: Tradingview, FOREX.com
However, PAY ATTENTION TO THE WEEKLY CHART! USD/CAD IS wound up tightly inside this symmetric triangle on the weekly chart. The downward sloping trendline comes in at roughly 1.3435. The upward sloping trendline comes in at roughly 1.3135. THE BREAK OF EITHER OF THESE TRENDLINES MAY DETERMINE THE NEXT LONGTERM DIRECTION OF USD/CAD.
Source: Tradingview, FOREX.com
Related tags:
Latest market news




Open an account in minutes
Experience award-winning platforms with fast and secure execution, and enjoy tight spreads from 0.5 pts on FX and 0.3 pts on indices.
Economic calendar
Web Trader platform
Our sophisticated web-based platform is packed with features.
Related articles
EUR/USD Q4 2026 Outlook: Euro at a Crossroads as Fed, ECB Tighten 9 25 2026
EUR/USD enters Q4 at a pivotal inflection point as competing Fed-ECB policy paths and persistent inflation risks collide with major technical support.

S&P 500 Forecast: SPX rises as oil prices fall, but treasuries remain at multi-decade highs
U.S. stocks are rising on Friday after a volatile week that saw a surge in Treasury yields ripple through financial markets.
AUD/USD Q4 Outlook: RBA and Fed Hikes Set the Tone
AUD/USD enters Q4 with RBA and Fed hikes in focus as sticky inflation, rising unemployment and US dollar strength shape the Australian dollar.

This report is intended for general circulation only. It should not be construed as a recommendation, or an offer (or solicitation of an offer) to buy or sell any financial products. The information provided does not take into account your specific investment objectives, financial situation or particular needs. Before you act on any recommendation that may be contained in this report, independent advice ought to be sought from a financial adviser regarding the suitability of the investment product, taking into account your specific investment objectives, financial situation or particular needs.
StoneX Financial Pte. Ltd., may distribute reports produced by its respective foreign entities or affiliates within the StoneX group of companies or third parties pursuant to an arrangement under Regulation 32C of the Financial Advisers Regulations. Where the report is distributed to a person in Singapore who is not an accredited investor, expert investor or an institutional investor (as defined in the Securities Futures Act), StoneX Financial Pte. Ltd. accepts legal responsibility to such persons for the contents of the report only to the extent required by law. Singapore recipients should contact StoneX Financial Pte. Ltd. at 6826 9988 for matters arising from, or in connection with the report.
In the case of all other recipients of this report, to the extent permitted by applicable laws and regulations neither StoneX Financial Pte. Ltd. nor its associated companies will be responsible or liable for any loss or damage incurred arising out of, or in connection with, any use of the information contained in this report and all such liability is hereby expressly disclaimed. No representation or warranty is made, express or implied, that the content of this report is complete or accurate.
StoneX Financial Pte. Ltd. is not under any obligation to update this report.
Trading CFDs carries a high level of risk that may not be suitable for some investors. Consider your investment objectives, level of experience, financial resources, risk appetite and other relevant circumstances carefully. The possibility exists that you could lose some or all of your investments, including your initial deposits. If in doubt, please seek independent expert advice. Visit www.forex.com/en-sg/terms-and-policies for the complete Risk Disclosure Statement.