



Why the Nikkei uptrend looks set to resume
Leading the recovery in Asian stock markets yesterday, the Nikkei 225 finished the day 2.08% higher at 28517, boosted by strong gains in semiconductor stocks, including Tokyo Electron and Advantest.
Share this:

The outperformance in semiconductor stocks promoted by reports Japan will offer tax breaks to revive domestic chipmaking to reverse decades of decline in the industry.
More broadly, the Japanese economy (and the Nikkei) has benefitted from a decision to close Japanese borders to all new foreign arrivals in late November. This decision has helped Japan avoid a surge in new Omicron covid cases being experienced elsewhere in the region, including South Korea and here in Australia.
The Nikkei is an indirect beneficiary of policy easing in China and central bank policy divergence. Specifically, while some developed market central banks, including the Federal Reserve and Bank of England, have commenced tightening policy, the Bank of Japan can remain patient.
Mindful that even after decades of ultra-loose monetary policy, inflation in Japan remains stuck near 0%, a long way from the Bank of Japan’s target.
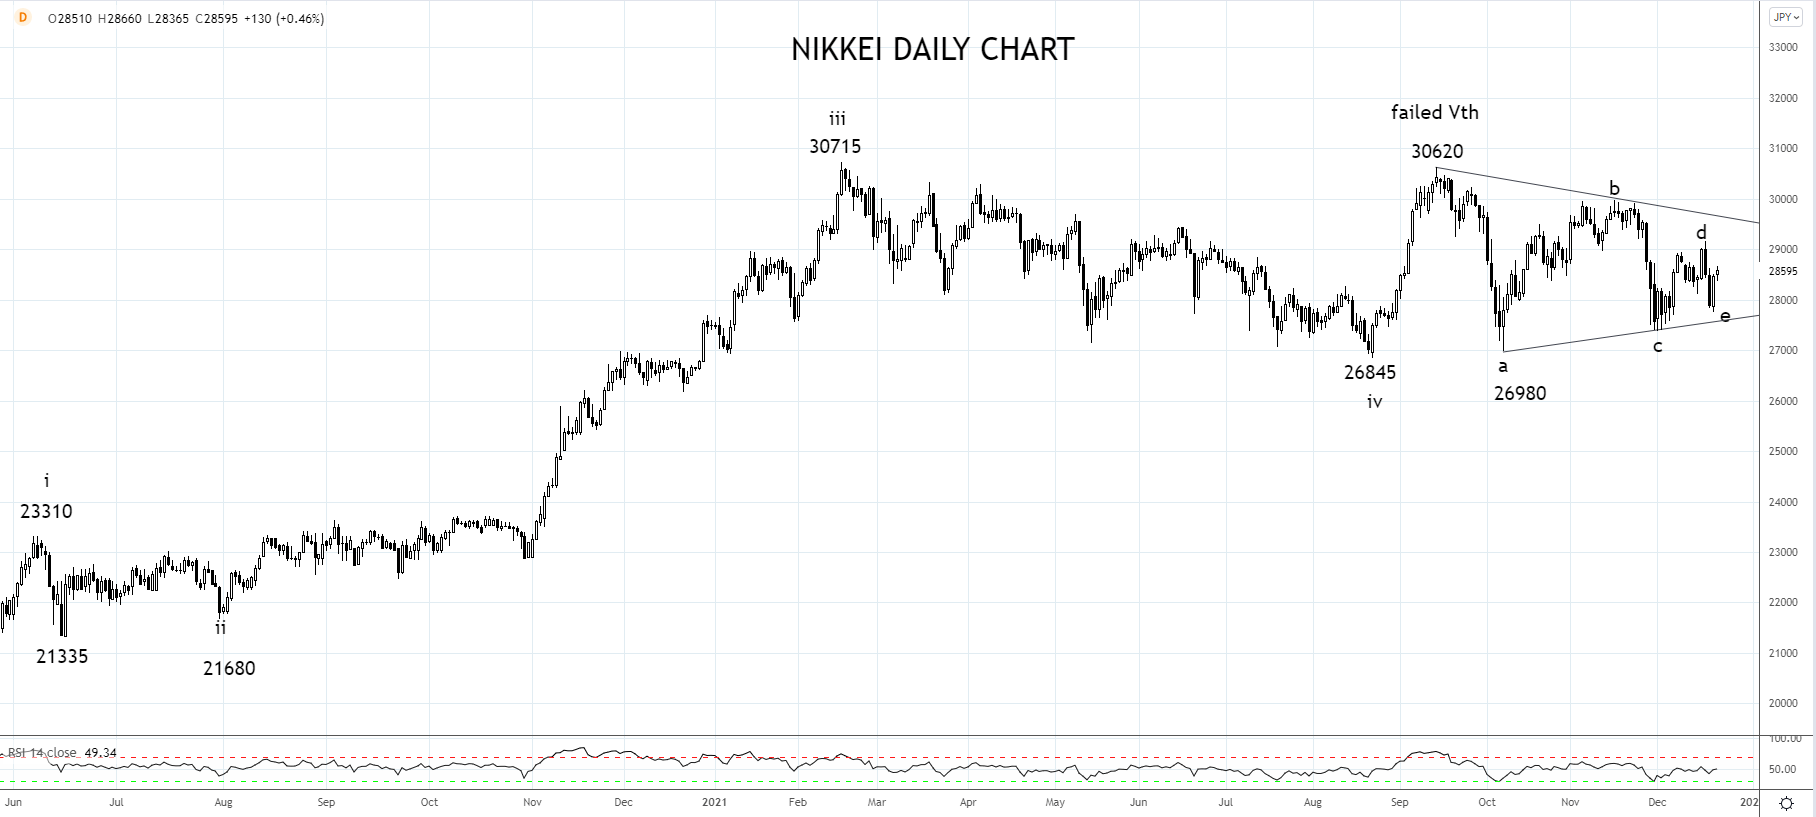
As the chart below shows, the Nikkei has spent the last three months of 2021 tracing out a correction after completing a five-wave advance from the 15,680 March 2020 Covid low at the September 30,620 high. The correction has unfolded in a triangular five wave “abcde” and appears complete at Monday's 27,745 low.
Should the Nikkei break and post a daily close above trendline resistance currently at 29,650ish, it would generate a buy signal in expectation of a retest and break of the 30,715 high before a move towards 32,000.
Source Tradingview. The figures stated areas of December 22nd, 2021. Past performance is not a reliable indicator of future performance. This report does not contain and is not to be taken as containing any financial product advice or financial product recommendation
How to trade with City Index
You can trade with City Index by following these four easy steps:
- Open an account, or log in if you’re already a customer
• Open an account in the UK
• Open an account in Australia
• Open an account in Singapore
- Search for the company you want to trade in our award-winning platform
- Choose your position and size, and your stop and limit levels
- Place the trade
The outperformance in semiconductor stocks promoted by reports Japan will offer tax breaks to revive domestic chipmaking to reverse decades of decline in the industry.
More broadly, the Japanese economy (and the Nikkei) has benefitted from a decision to close Japanese borders to all new foreign arrivals in late November. This decision has helped Japan avoid a surge in new Omicron covid cases being experienced elsewhere in the region, including South Korea and here in Australia.
The Nikkei is an indirect beneficiary of policy easing in China and central bank policy divergence. Specifically, while some developed market central banks, including the Federal Reserve and Bank of England, have commenced tightening policy, the Bank of Japan can remain patient.
Mindful that even after decades of ultra-loose monetary policy, inflation in Japan remains stuck near 0%, a long way from the Bank of Japan’s target.
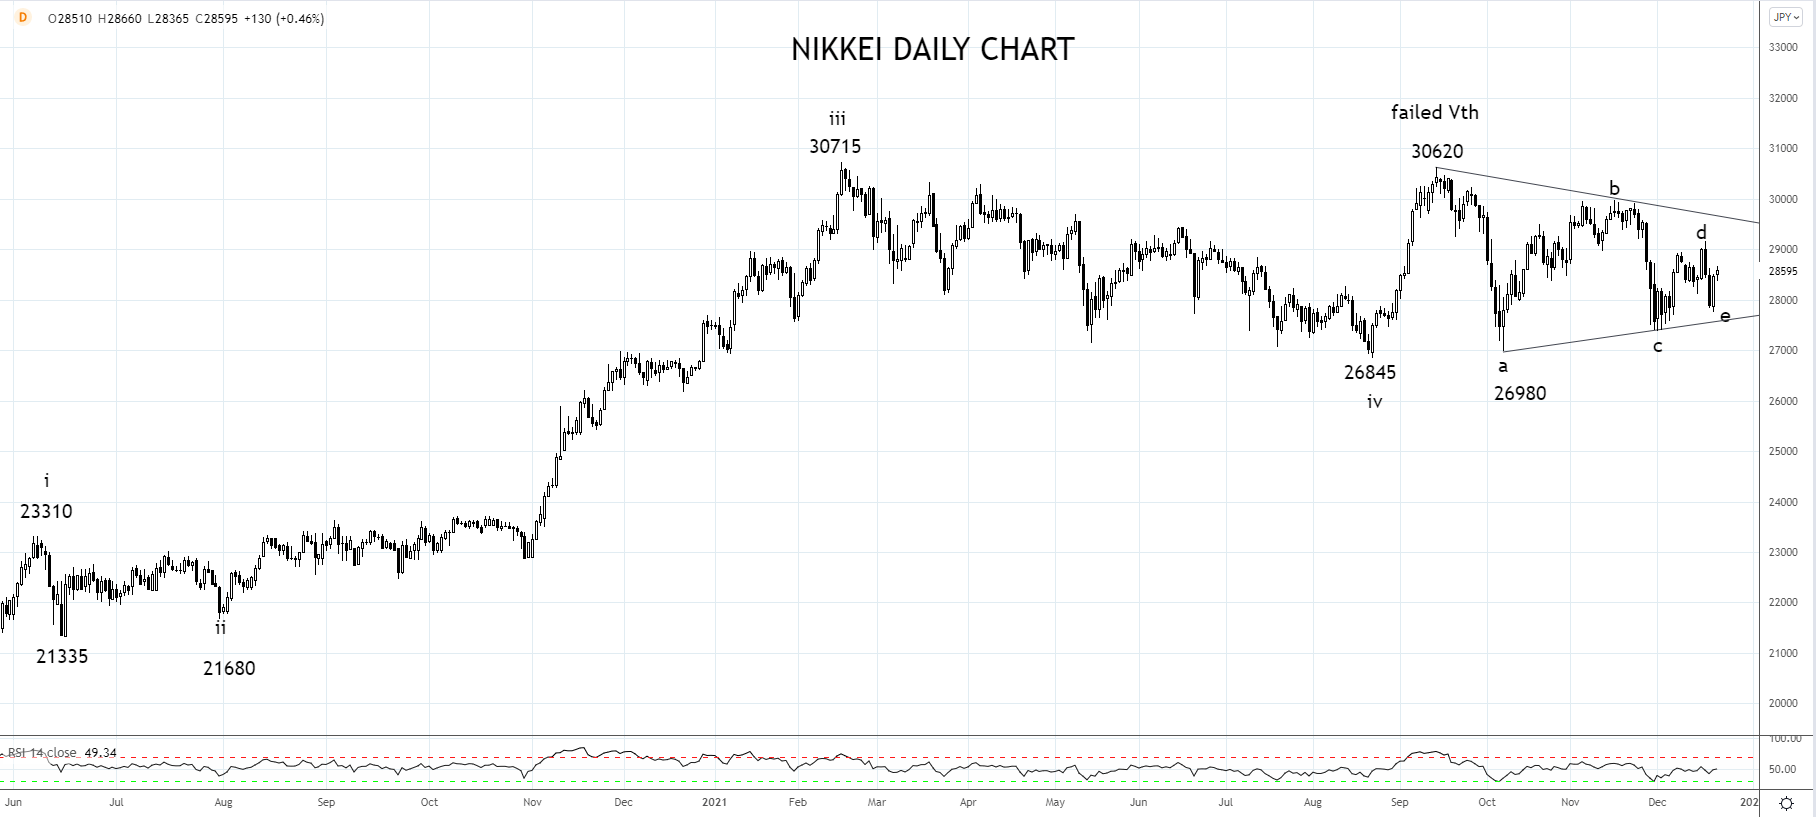
As the chart below shows, the Nikkei has spent the last three months of 2021 tracing out a correction after completing a five-wave advance from the 15,680 March 2020 Covid low at the September 30,620 high. The correction has unfolded in a triangular five wave “abcde” and appears complete at Monday's 27,745 low.
Should the Nikkei break and post a daily close above trendline resistance currently at 29,650ish, it would generate a buy signal in expectation of a retest and break of the 30,715 high before a move towards 32,000.
Source Tradingview. The figures stated areas of December 22nd, 2021. Past performance is not a reliable indicator of future performance. This report does not contain and is not to be taken as containing any financial product advice or financial product recommendation
- Open a Forex.com account, or log in if you’re already a customer.
- Search for the pair you want to trade in our award-winning platform.
- Choose your position and size, and your stop and limit levels.
- Place the trade.
Related tags:



Open an account in minutes
Experience award-winning platforms with fast and secure execution, and enjoy tight spreads from 0.5 pts on FX and 0.3 pts on indices.
Economic calendar
Web Trader platform
Our sophisticated web-based platform is packed with features.
Related articles

Nikkei threatens breakout as tech rebound broadens
Breakouts across the SOX and Nasdaq are being matched by rebounds across Asia, with the Nikkei now threatening to join the move.


USD/JPY Analysis: Is the Yen Still Weak Despite the BOJ Rate Hike?
The Japanese yen continues to face challenging conditions in the short term. By the end of the week, USD/JPY had gained nearly 2.00% over the previous five trading sessions, highlighting ongoing weakness in the yen and showing that the U.S. dollar continues to gain ground.


BOJ split vote fuels yen weakness and Nikkei gains
A divided BOJ hike has left the yen under pressure and Nikkei bid, with Ueda now needing to convince markets that another two-and-a-half hikes by mid-2027 are justified.
This report is intended for general circulation only. It should not be construed as a recommendation, or an offer (or solicitation of an offer) to buy or sell any financial products. The information provided does not take into account your specific investment objectives, financial situation or particular needs. Before you act on any recommendation that may be contained in this report, independent advice ought to be sought from a financial adviser regarding the suitability of the investment product, taking into account your specific investment objectives, financial situation or particular needs.
StoneX Financial Pte. Ltd., may distribute reports produced by its respective foreign entities or affiliates within the StoneX group of companies or third parties pursuant to an arrangement under Regulation 32C of the Financial Advisers Regulations. Where the report is distributed to a person in Singapore who is not an accredited investor, expert investor or an institutional investor (as defined in the Securities Futures Act), StoneX Financial Pte. Ltd. accepts legal responsibility to such persons for the contents of the report only to the extent required by law. Singapore recipients should contact StoneX Financial Pte. Ltd. at 6826 9988 for matters arising from, or in connection with the report.
In the case of all other recipients of this report, to the extent permitted by applicable laws and regulations neither StoneX Financial Pte. Ltd. nor its associated companies will be responsible or liable for any loss or damage incurred arising out of, or in connection with, any use of the information contained in this report and all such liability is hereby expressly disclaimed. No representation or warranty is made, express or implied, that the content of this report is complete or accurate.
StoneX Financial Pte. Ltd. is not under any obligation to update this report.
Trading CFDs carries a high level of risk that may not be suitable for some investors. Consider your investment objectives, level of experience, financial resources, risk appetite and other relevant circumstances carefully. The possibility exists that you could lose some or all of your investments, including your initial deposits. If in doubt, please seek independent expert advice. Visit www.forex.com/en-sg/terms-and-policies for the complete Risk Disclosure Statement.