


WTI crude oil analysis: Asian Open – 8th July 2023
Monday's trade saw WTI hand back almost all of Friday’s gain and produce a 2-bar reversal pattern (dark cloud cover). And with that comes the potential for a deeper pullback, so long as prices remain beneath yesterday’s high. For today, we'll keep a close eye on the January high, which is likely to be a pivotal level today.
Share this:

Market Summary:
- Fed member John Williams said in a pre-recorded interview on Monday that he thinks “we’re pretty close to what a peak rate would be” and that the debate for the upcoming meeting is really about whether they need another rate increase, or not.
- Given Fed fund futures have been pricing in a pause in September at least 80% or more for the last few weeks suggests this debate has already been settled
- Yet Fed Governor Michelle Bowman seems set to vote for another hike, saying in a separate interview that she expects “additional increases will likely be needed to lower inflation”
- The BOJ discussed the potential for sustained inflation, according to the Summary of Opinions from their last meeting. However, they are still not anywhere close to raising rates if their comment that “there is still a significantly long way to go before revising the negative interest rate policy” is to be believed
- Wall Street posted cautions gains, with the Nasdaq holding above the March 2022 high for a third consecutive session although weighed down by Apple (AAPL)
- Apple (AAPL) shares continued to slide following last week’s earnings report, currently down -6.3% over two sessions having broken out of its bullish channel
- 09:30 – Japan’s household spending, wages
- 09:50 – Japan’s current account, bank lending, retail sales
- 10:30 –Australia consumer sentiment (Westpac)
- 11:30 – Australian business confidence (NAB)
- 13:00 – China’s trade balance
- 16:00 – German CPI


Technically Speaking:
- Whilst prices initially dipped lower in the European session, USD/JPY went on to form a 2-bar bullish reversal pattern, which suggests upside potential today
- EUR/USD retraced and perfectly respected Thursday’s high and formed a prominent intraday swing low before closing above 1.10. The bias now remains bullish above yesterday’s low.
- Gold also retraced before finding support around Friday’s open price of 1932, and is now trying to build support around the 1935 volume cluster mentioned in yesterday’s Asian open report. Ideally looking for bullish momentum to return sooner than later to retain the near-term bullish bias for a run to 1950 – 1955.
- AUD/USD formed a small inside day and Doji formed on Monday, so we’re still waiting to see if bears will drive it lower for another leg towards 0.6500 or the YTD lows, or if bulls can break above 0.6600 and deem last week’s break of support as another fakeout.
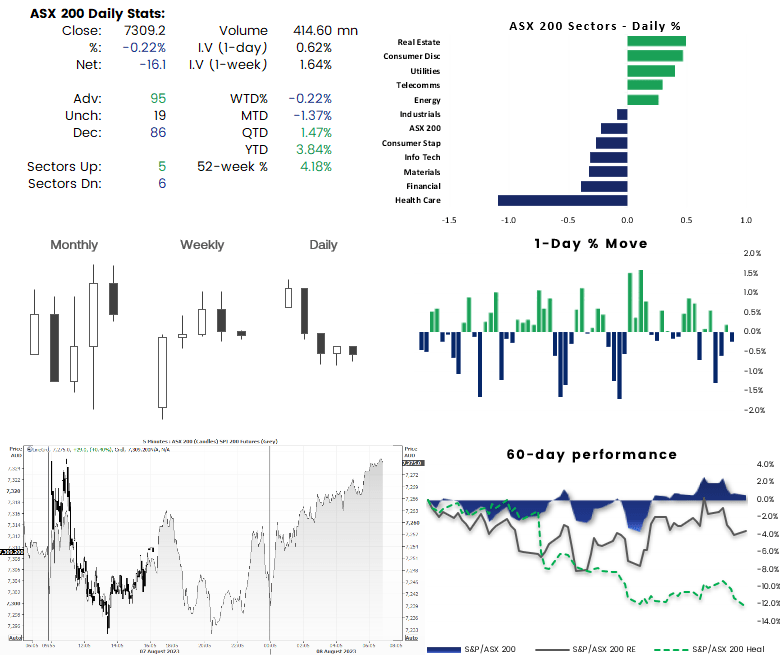
ASX 200 at a glance:
- The ASX 200 formed a small bearish inside day on Monday, but it formed a slight higher low relative to last week’s low above 7290 support
- SPI futures and Wall Street point to a slightly higher open
- We favour a near-term technical bounce towards the 7350 – 7368 region whilst prices remain above last week’s low

WTI crude oil daily chart:
We noted in yesterday’s COT report that WTI had rallied into the YTD highs, which is a likely area to prompt a consolidation or retracement. Monday trade saw WTI hand back almost all of Friday’s gain and produce a 2-bar reversal pattern (dark cloud cover). And with that comes the potential for a deeper pullback, so long as prices remain beneath yesterday’s high. Volumes were also lower which shows a lack of enthusiasm to drive the market high, but it also means bears are no steeping into the market in droves.


WTI crude oil 1-hour chart:
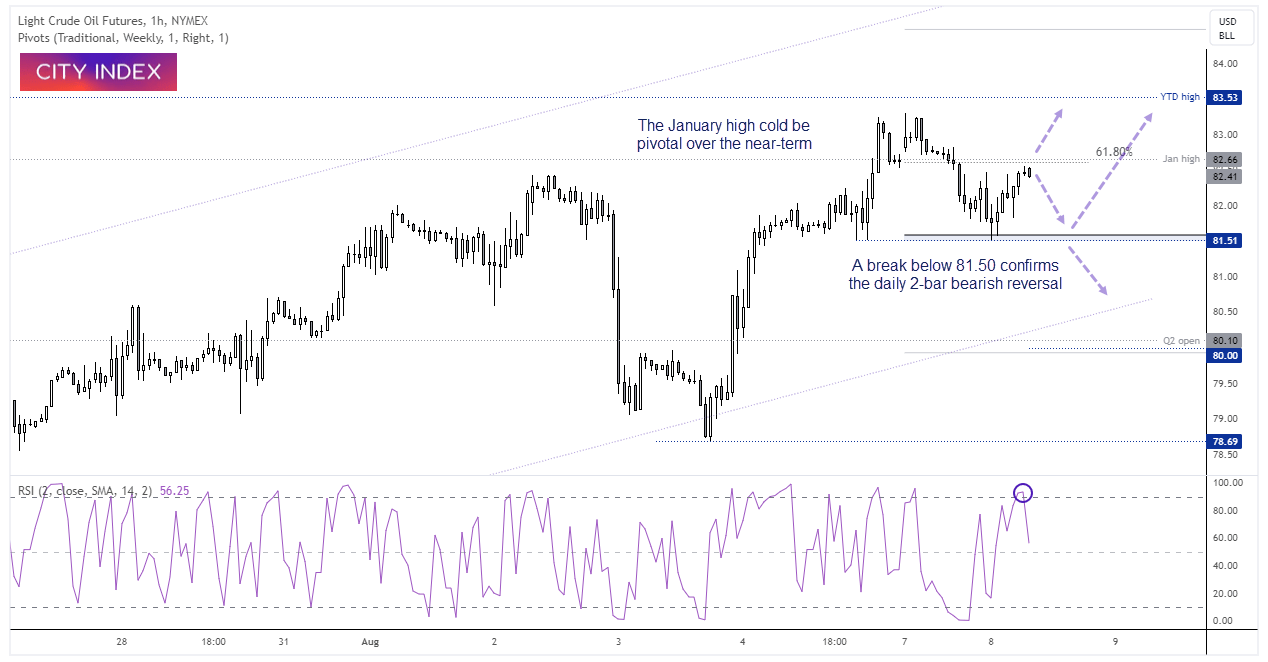
The 1-hour chart shows support was found at the weekly pivot point, and prices have reverted to the January high. We suspect this could be a pivotal level for today’s session and may prompt a pullback early on, given RSI (2) reached overbought. The question now is whether we’ll see bears step up their game, but we’d also need to see USD strength. A break beneath yesterday’s lows confirms the daily 2-bar reversal and opens up a run towards the lower trendline or 80 level.
-- Written by Matt Simpson
Follow Matt on Twitter @cLeverEdge
How to trade with City Index
You can trade with City Index by following these four easy steps:
- Open an account, or log in if you’re already a customer
• Open an account in the UK
• Open an account in Australia
• Open an account in Singapore
- Search for the market you want to trade in our award-winning platform
- Choose your position and size, and your stop and limit levels
- Place the trade
Related tags:


Open an account in minutes
Experience award-winning platforms with fast and secure execution, and enjoy tight spreads from 0.5 pts on FX and 0.3 pts on indices.
Economic calendar
Web Trader platform
Our sophisticated web-based platform is packed with features.
Related articles

Nikkei breakout accelerates as yen weakness returns
Nikkei has started October with a powerful breakout, helped by renewed yen weakness and strong upside momentum


Japanese Yen Outlook: USD/JPY, GBP/JPY, AUD/JPY Setups
USD/JPY and GBP/JPY show signs of stabilising, while AUD/JPY remains vulnerable as yen crosses deliver mixed technical signals.

The RBA Hiked Rates and the Australian Dollar Still Fell
AUD/USD fell after the RBA rate hike because the central bank's hawkish stance was already priced in while the U.S. dollar stayed firm.

This report is intended for general circulation only. It should not be construed as a recommendation, or an offer (or solicitation of an offer) to buy or sell any financial products. The information provided does not take into account your specific investment objectives, financial situation or particular needs. Before you act on any recommendation that may be contained in this report, independent advice ought to be sought from a financial adviser regarding the suitability of the investment product, taking into account your specific investment objectives, financial situation or particular needs.
StoneX Financial Pte. Ltd., may distribute reports produced by its respective foreign entities or affiliates within the StoneX group of companies or third parties pursuant to an arrangement under Regulation 32C of the Financial Advisers Regulations. Where the report is distributed to a person in Singapore who is not an accredited investor, expert investor or an institutional investor (as defined in the Securities Futures Act), StoneX Financial Pte. Ltd. accepts legal responsibility to such persons for the contents of the report only to the extent required by law. Singapore recipients should contact StoneX Financial Pte. Ltd. at 6826 9988 for matters arising from, or in connection with the report.
In the case of all other recipients of this report, to the extent permitted by applicable laws and regulations neither StoneX Financial Pte. Ltd. nor its associated companies will be responsible or liable for any loss or damage incurred arising out of, or in connection with, any use of the information contained in this report and all such liability is hereby expressly disclaimed. No representation or warranty is made, express or implied, that the content of this report is complete or accurate.
StoneX Financial Pte. Ltd. is not under any obligation to update this report.
Trading CFDs carries a high level of risk that may not be suitable for some investors. Consider your investment objectives, level of experience, financial resources, risk appetite and other relevant circumstances carefully. The possibility exists that you could lose some or all of your investments, including your initial deposits. If in doubt, please seek independent expert advice. Visit www.forex.com/en-sg/terms-and-policies for the complete Risk Disclosure Statement.