



WTI Forecast: Hormuz Risks, Aramco Impact, and OPEC Supply
WTI Crude Oil Forecast: Following a disruptive weekend involving the battle against the Iranian regime, defensive measures have risen across the Middle East. Between sky control and market control, crude prices lifted on renewed supply disruption risks via the Strait of Hormuz and key oil facilities such as Aramco.
Share this:

I recorded this video on Friday, ahead of the escalation, comparing the 2025 12-Day Iran War and the possible 2026 setup. The updated analysis is in the final section of this article.
What is the Strait of Hormuz?
The Strait of Hormuz is a narrow two-mile passage, that’s it, two miles of water shaking global economic headlines, where 20-30% of global oil and gas supply pass by sea.
It sits between Iran to the north and Oman/UAE to the south, linking key exporters including:
- Saudi Arabia
- UAE
- Iraq
- Kuwait
- Qatar
And key importers China, India, Japan, and South Korea, influencing global pricing and spreads across
- Crude oil
- Natural gas
- Jet fuel
- Energy equities
- Import dependent currencies
Bypass Alternatives, and Why they Fall Short
There are two pipelines that can bypass the Strait. Together, they handle roughly 25% of normal flows.
- Saudi Arabia’s East-West Pipeline: Can transport up to 7 million b/d to the Red Sea. However, the Red Sea itself carries geopolitical risk from Houthi attacks.
- The UAE’s Fujairah Pipeline: Adds around 1.8 million b/d, but only covers Abu Dhabi’s onshore fields. Roughly half of the UAE’s total production still faces export risk.
- Qatar, Kuwait, and Iraq have no true bypass alternatives. Qatar’s LNG physically cannot exit any other way.
Current State (As of March 2nd, 2026)
As of today, the Strait remains constrained rather than fully blocked. However, with recent attacks on vessels and insurance premiums rising to six-year highs, the passage is now economically and physically high risk for most operators.
The market impact is behaving as if the strait is closed, pricing the risks in.
How Does This Impact Crude Prices? What Is the Forward Outlook?
With Strait risks dominating headlines, shifting focus from glut concerns back to supply disruption, crude prices gapped over 3% on Monday’s open, with WTI peaking near 75band Brent near 82.
While risks are escalating towards Europe including British bases, OPEC’s announcement to increase production in April by 206,000 b/d, ending a three-month pause, added a hint of supply stabilization. Still, should conditions continue to escalate, supply risks are expected to persist.
A recent incident involving Saudi Aramco added further supply disruption concerns, potentially exposing crude prices toward inflationary territory should escalation prolong.
Regionally:
- The TASI gapped down on Sunday’s open
- Global equities reflected negative sentiment on Monday’s open
- Safe havens, precious metals and the US dollar, moved higher.
- The ADX and DFM closed in an attempt to maintain price control amid this unprecedented escalation
Technical Analysis: Will the Price Gap Close?
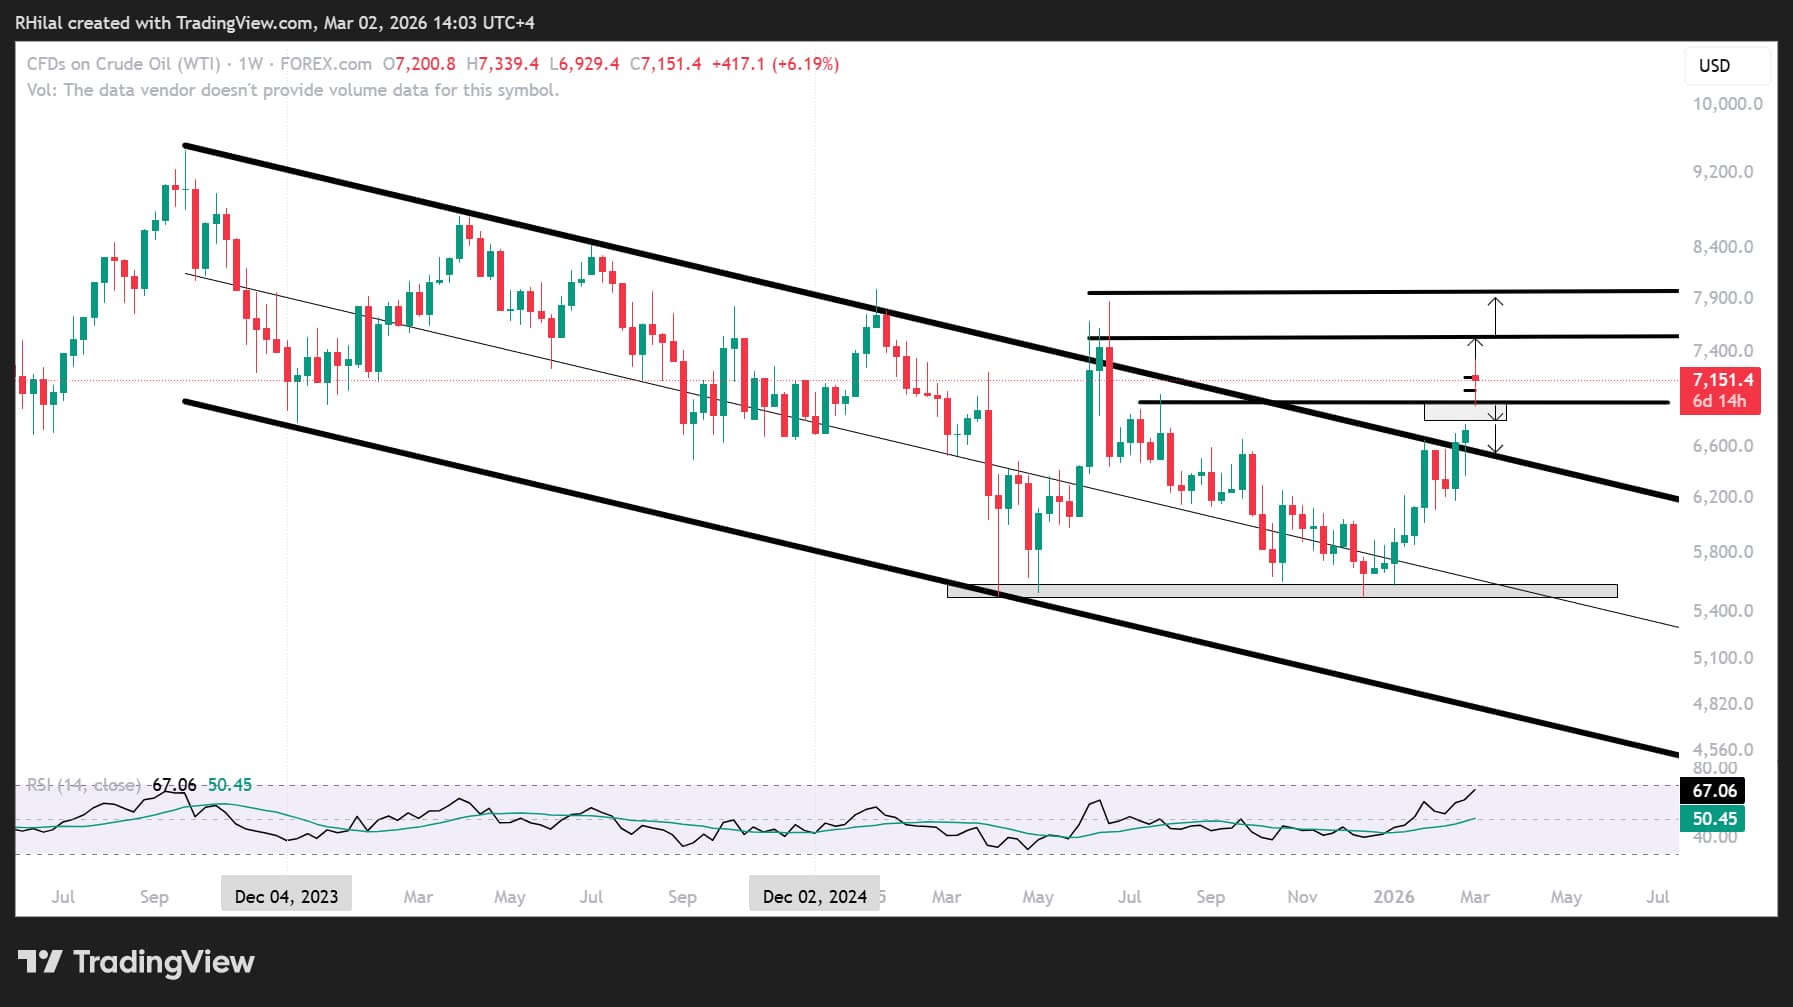
WTI Forecast: Weekly Time Frame – Log Scale
Source: Trading view
WTI gapped above the 70 mark, reaching a high near 75.30 before reverting toward 72.
From a technical standpoint, traders may look at a potential gap-closing move into the 68–69.30 zone as a corrective scenario should prices fall back below 72.
A further close below 68 would expose the upper boundary of the 2.5-year down trending channel in place since September 2023, opening the debate between a bullish rebound attempt or broader bearish reassertion.
On the upside a sustained close back above 75 would expose the 79 region, echoing the 12-Day Iran War move of 2025. A sustained break above 80 would challenge the longer-term bullish structure. Failure there could rotate price action back toward glut risks and the 70–60 mean zone.
The RSI is rising toward levels last seen in September 2023, suggesting upside momentum may face technical limitations, should fundamentals align.
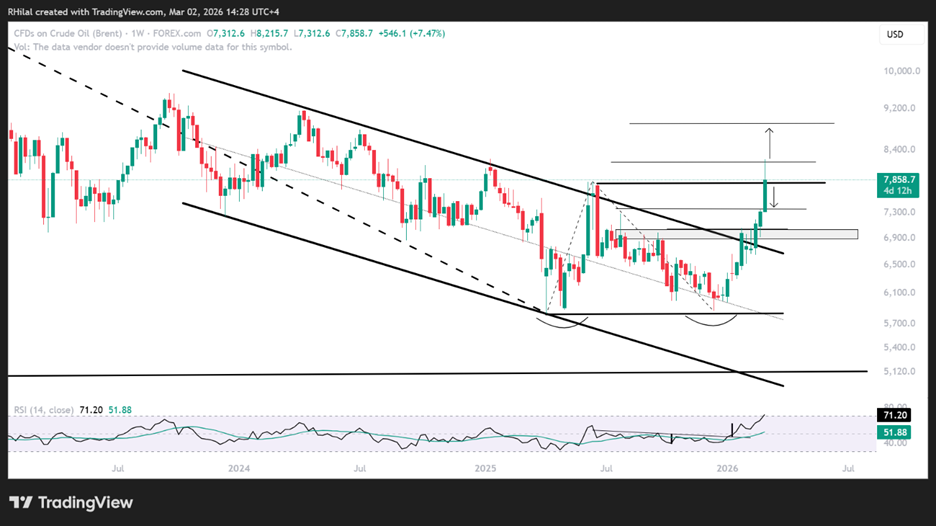
Brent Forecast: Weekly Time Frame – Log Scale
Source: Tradingview
From Brent’s perspective, highs have surpassed those of 2025, reaching 82. However, price action is still attempting to hold above the 2025 highs near 78, keeping upside risks exposed toward 82 and potentially 89 respectively.
A close back below 76 and then 73 would re-expose the 70 zone and the upper boundary of the broader downtrending channel, opening the door for either a bullish retest from support or a realignment with the prevailing bearish bias in place since 2022.
Razan Hilal, CMT
Follow on X: @Rh_waves
Latest market news




Open an account in minutes
Experience award-winning platforms with fast and secure execution, and enjoy tight spreads from 0.5 pts on FX and 0.3 pts on indices.
Economic calendar
Web Trader platform
Our sophisticated web-based platform is packed with features.
Related articles
USD/JPY Q4 2026 Outlook: Hawkish Fed Pricing Clashes With Intervention Risk
The year-end tug-of-war is clear: hawkish Fed pricing supports USD/JPY, while intervention risk limits the upside.

Japanese Yen Forecast: USD/JPY 4% Rally Challenges Post-Intervention Downtrend 9 24 2026
USD/JPY momentum has shifted sharply higher, putting a major resistance confluence in focus as U.S. and Japanese event risk builds.


Oil Quietly Hands the Fed a Reason to Stay Hawkish
Oil prices and the U.S. dollar are both on the front foot as elevated energy costs feed Fed warnings that inflation may prove sticky.

This report is intended for general circulation only. It should not be construed as a recommendation, or an offer (or solicitation of an offer) to buy or sell any financial products. The information provided does not take into account your specific investment objectives, financial situation or particular needs. Before you act on any recommendation that may be contained in this report, independent advice ought to be sought from a financial adviser regarding the suitability of the investment product, taking into account your specific investment objectives, financial situation or particular needs.
StoneX Financial Pte. Ltd., may distribute reports produced by its respective foreign entities or affiliates within the StoneX group of companies or third parties pursuant to an arrangement under Regulation 32C of the Financial Advisers Regulations. Where the report is distributed to a person in Singapore who is not an accredited investor, expert investor or an institutional investor (as defined in the Securities Futures Act), StoneX Financial Pte. Ltd. accepts legal responsibility to such persons for the contents of the report only to the extent required by law. Singapore recipients should contact StoneX Financial Pte. Ltd. at 6826 9988 for matters arising from, or in connection with the report.
In the case of all other recipients of this report, to the extent permitted by applicable laws and regulations neither StoneX Financial Pte. Ltd. nor its associated companies will be responsible or liable for any loss or damage incurred arising out of, or in connection with, any use of the information contained in this report and all such liability is hereby expressly disclaimed. No representation or warranty is made, express or implied, that the content of this report is complete or accurate.
StoneX Financial Pte. Ltd. is not under any obligation to update this report.
Trading CFDs carries a high level of risk that may not be suitable for some investors. Consider your investment objectives, level of experience, financial resources, risk appetite and other relevant circumstances carefully. The possibility exists that you could lose some or all of your investments, including your initial deposits. If in doubt, please seek independent expert advice. Visit www.forex.com/en-sg/terms-and-policies for the complete Risk Disclosure Statement.