EUR/USD, Euro Talking Points:
- EUR/USD is off to a fast start for Q3 as the pair trades at fresh three-year highs.
- The pair is currently overbought on both the daily and weekly charts making chasing breakouts a challenge, but as looked at in yesterday’s webinar, support structure remains in-place and so far we’ve seen a hold and a bounce from the Fibonacci level at 1.1748.
- Tomorrow brings Non-farm Payrolls on a Thursday given the 4th of July holiday on Friday, and this will keep both EUR/USD and the USD in focus into the end of the week.
- I focus on both markets in the weekly webinar and you’re welcome to attend the next: Click here to register.

It’s been a historically strong start to the year for EUR/USD and interestingly this comes after the pair was in a fairly bearish state at the 2025 open. While parity calls were plentiful back then, prices have stretched aggressively in the other direction and at this point, EUR/USD is overbought on both the daily and weekly charts. That weekly overbought reading is especially notable, as the indicator is nearing the 75 level and is currently at it’s highest point since January of 2018, when the pair topped before an almost 2,000 pip sell-off over the next two years.
Like I highlight in webinars, overbought doesn’t necessarily mean bearish reversal but it does highlight the context of how dangerous it can be to chase the move-higher on fresh breakouts. Notice how for that prior instance of overbought RSI on the weekly that turned into reversal, it took time for bears to finally take-control, illustrating the persistent push through support that, eventually, allowed for a turn.
EUR/USD Weekly Chart
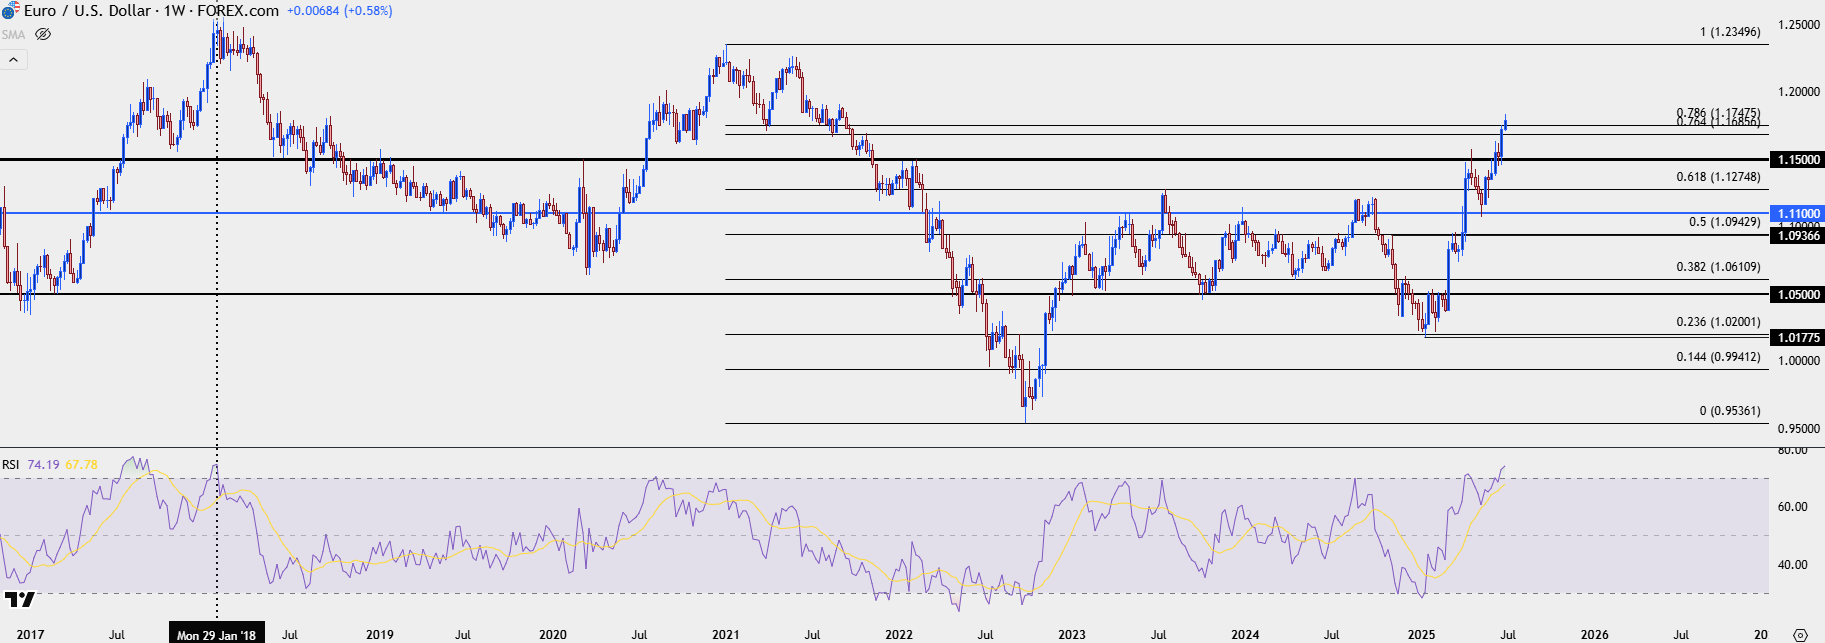
Chart prepared by James Stanley; data derived from Tradingview
EUR/USD Structure
In last Thursday’s article I highlighted a Fibonacci retracement of note in EUR/USD, and this is something I’ve been talking about for most of the year. This is from the 2021-2022 major move, and there’s been several inflections at key retracement levels for the pair. In 2023, the high for the year showed right at the 61.8% level. And then last year, we saw numerous inflections at the 50% mark of 1.0943 and the low in April, which held until December, printed right at the 38.2% retracement of that same setup.
I featured this as part of a larger evergreen article on Fibonacci in February when, at the time, EUR/USD sellers were still somewhat in control. But – we had just seen the 23.6% retracement of that move come into play in January and that’s where bulls were staging a setup for change.
Once again, it wasn’t like a light switch suddenly getting flipped ‘on’ and there was some gyration, but bulls took over in March and prodded a massive move higher as EUR/USD broke out in historic fashion.
Along the way, the pair stair-stepped on that Fibonacci retracement with a rally up to the 50% mark of 1.0943, and then a push up to the 61.8% at 1.1275 which showed as support-turned-resistance-turned-support again.
And since that last inflection in late-May, bulls have very much been in-charge, driving the pair to fresh three-year highs.
EUR/USD Daily Price Chart
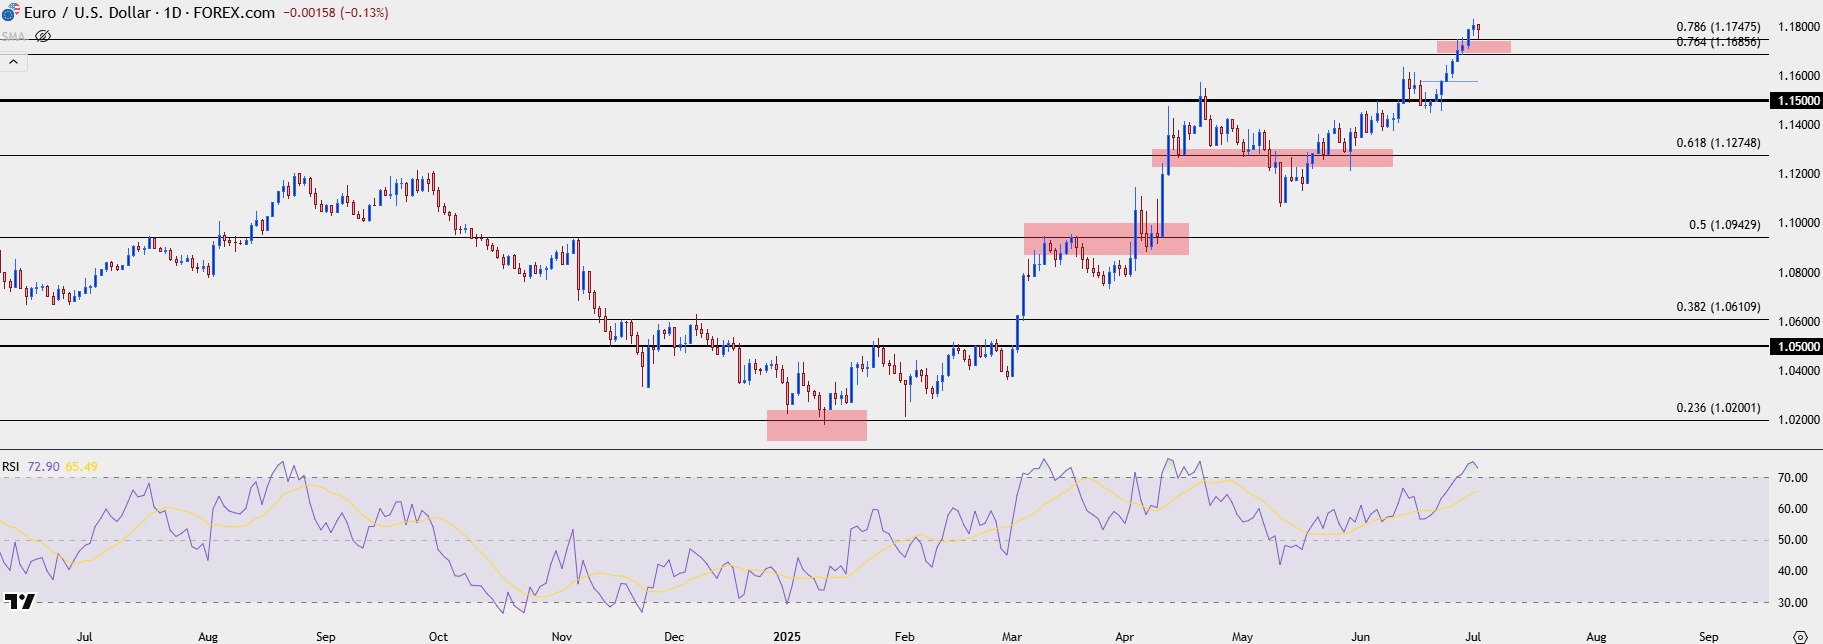
Chart prepared by James Stanley; data derived from Tradingview
EUR/USD Near-Term Strategy
More recently and of interest for current strategy are the deeper stretches of the retracement. Both the 76.4 and 78.6% levels are often tracked, although traders usually pick one or the other. But over the past week both of those levels have offered points of interest for the pair’s path. That’s what prompted the article last Thursday as we had started to see a show of short-term resistance at the 78.6% level of 1.1748, after which a pullback held support at the 76.4% marker of 1.1686.
Bulls defended that well and as I looked at in yesterday’s webinar, the door was now opened for a higher-low at the 1.1748 level, and that’s what’s helped to hold the daily low so far today.
With NFP tomorrow we should expand the range of possible scenarios and given the drastic showing in this morning’s ADP data, I think expectations will be fairly low, at least for the headline print. So, in my opinion, the more interesting scenario is whether a stronger-than-expected print can allow for a quick show of USD-strength, which could then bring pullback in EUR/USD. At that point, the 1.1748 level could be back in the picture as could the 76.4% retracement at 1.1686. Both could continue to carry attraction for supports in bullish trend continuation scenarios.
EUR/USD Four-Hour Chart
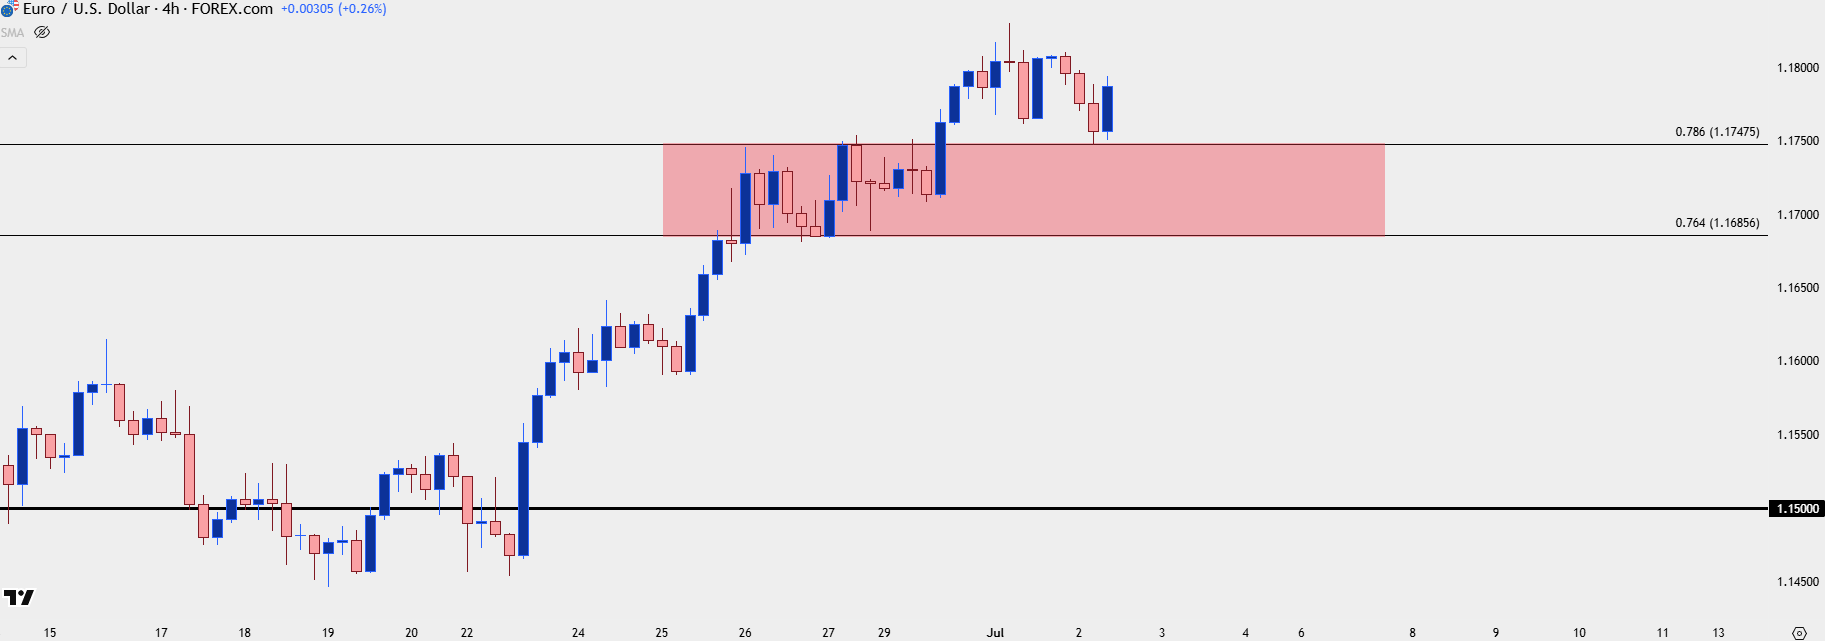
Chart prepared by James Stanley; data derived from Tradingview
--- written by James Stanley, Senior Strategist