
U.S. Dollar Talking Points:
- It was a bearish start to the year for the USD coming in stark contrast to the strength that showed at the 2025 open.
- This webinar looked at a variety of setups around the USD including EUR/USD, Gold, USD/JPY, USD/CAD and GBP/USD. Also looked at were EUR/JPY and GBP/JPY setups, along with S&P 500, Nasdaq 100 and Bitcoin towards the end.
- To join the next weekly webinar, click here to register.
It was a brutal first half of 2025 for the U.S. Dollar. The currency came into the year riding high on the Q4 bullish trend last year, which was one of the strongest quarterly moves of the past decade. But DXY topped within the first two weeks of the year and a sell-off started that just continued to grind through Q2.
As we open the door to the second half and Q3 of 2025, the U.S. Dollar has just set a fresh three-year low. There’s now lower-high resistance potential at prior support, around both the 97 and 98 handle in DXY.
U.S. Dollar Four-Hour Price Chart
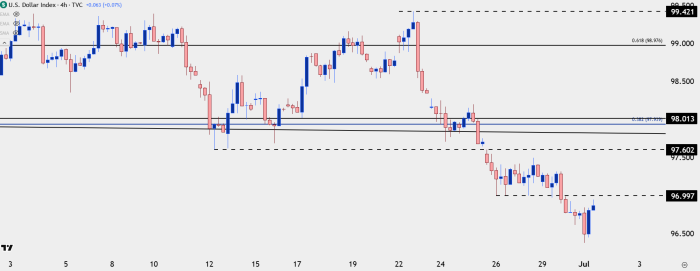
Chart prepared by James Stanley; data derived from Tradingview
EUR/USD
EUR/USD put in a major move in 2021 and 2022 as the Fed’s rate hike campaign drove a historic rally in the Greenback. The Fibonacci retracement from that major move continues to show items of interest for traders, particularly swing traders, and as we go into the second-half of the year the pair is trading at fresh three-year highs while testing above the 78.6% retracement from that major move.
EUR/USD Weekly Price Chart
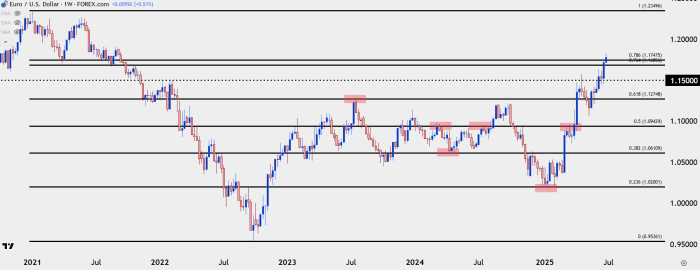
Chart prepared by James Stanley; data derived from Tradingview
Shorter-term, EUR/USD has built bullish structure on both the 76.4 and 78.6% retracements of that major move. The 78.6% marker set resistance last week and that’s now a spot of higher-low support potential. Below that, at the 76.4% mark, we have the prior higher-low at 1.1686, which is the level that bulls need to defend to keep the door open for bullish momentum. A breach below that opens the door for a larger pullback in the pair.

EUR/USD Four-Hour Chart
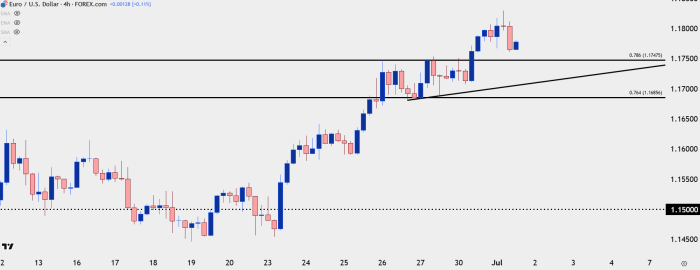
Chart prepared by James Stanley; data derived from Tradingview
USD/JPY
If we are going to see a larger breakdown in the USD in the back-half of 2025, there will likely need to be some participation from USD/JPY.
Even with the Dollar dwindling down to fresh three-year-lows USD/JPY has held above the low set in April at the 140.00 handle. As I had discussed in the webinar, there’s a lot of macro connotations around that market given the carry trade; and a breach of 140.00 could bring on a host of consequences. Deductively, the fact that USD/JPY remains above the April low even though DXY does not highlights the fact that the Japanese Yen has been relatively weak. And this could make for attractive backdrops of bullish continuation in pairs like EUR/JPY or GBP/JPY, as I’ve been following in both articles and videos.
USD/JPY Daily Chart
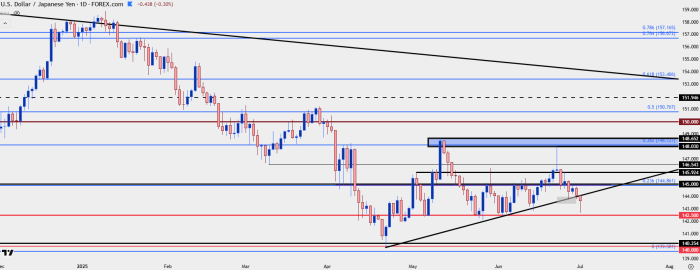
Chart prepared by James Stanley; data derived from Tradingview
USD/CAD
I remain interested in USD/CAD for bearish USD scenarios given the long-term range, and one of the problems right now is just how entrenched the sell-off has become. But, there has been pullback.
In last week’s webinar I looked at a spot of support at 1.3679-1.3994, highlighting pullback potential into the 1.3750 zone. That resistance was in play a day later and led to fresh lows, and that same resistance came back at the end of the week after a social media comment from President Trump. In this week’s webinar, I looked at updated levels and context for the USD/CAD pair.
USD/CAD Four-Hour Chart
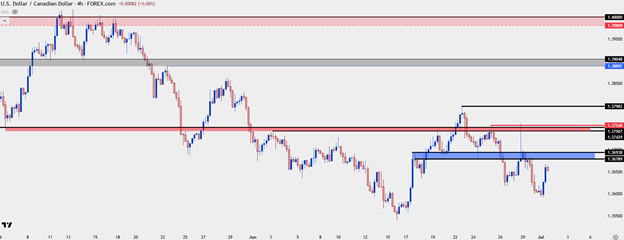
Chart prepared by James Stanley; data derived from Tradingview
GBP/USD
GBP/USD is another pair that I’ve been following for USD-weakness, and in last week’s webinar I looked at support from prior resistance taken around the 1.3593 level. That price was in-play the morning after and helped to lead to a launched move up to fresh three-year highs.
At this point, there’s support potential around the 1.3670 swing after which the same zone comes back into play from 1.3593-1.3617. Holding above the prior swing-low would be the key for bullish momentum scenarios to remain attractive.
GBP/USD Four-Hour Price Chart
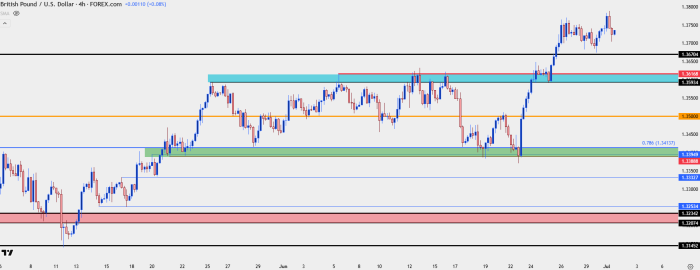
Chart prepared by James Stanley; data derived from Tradingview
--- written by James Stanley, Senior Strategist