
US Dollar Talking Points:
- It was another strong week for the DXY basket as the currency rallied up to a fresh 19-month high. Extending the conversation from the Tuesday webinar, the weekly chart retains an open door for continuation following the jostling at support that led into the prior week.
- EUR/USD pushed below 1.1000 and bulls were unable to elict much of a pullback, and even GBP/USD, which had previously held strong, succumbed to the DXY rally.
- USD/JPY remains of interest as the pair has been bristling for breakout at the 160.00 handle. I looked into the pair on Thursday and the ‘s3’ support from that article has so far held the lows.
There’s a few different common reasons that we’ll see a prolonged USD rally, with the most obvious being higher inflation driving rate hike expectations. This is like what we saw back in 2022, as the Fed was gearing up to and eventually started hiking rates in near-historic fashion. But, there’s another driver that can show up and of late, it seems like that’s what we’ve been seeing as jitters around the AI bubble and the shifting backdrop of the Federal Reserve pushing flows into the USD, to go along with that higher rate backdrop.
As I’ll often look at in these pieces, currencies are unique: They’re the foundation of the global financial system and as such, for a currency to rally, it will deductively need other currencies to weaken. This can be somewhat obvious in a currency pair like the EUR/USD or GBP/USD, as even the strongest data in the world can fail to inspire a rally, provided that there’s even stronger data on the other side of the pair. But, in the US Dollar, where the global reserve is measured as a basket of currencies, commonly the DXY basket, that look can be, at times, confusing.
But as we had looked at in the webinar two weeks ago and then again last week, the failure from sellers to take over after five consecutive weeks of support tests has led into a clear case of bullish control.
US Dollar Weekly Chart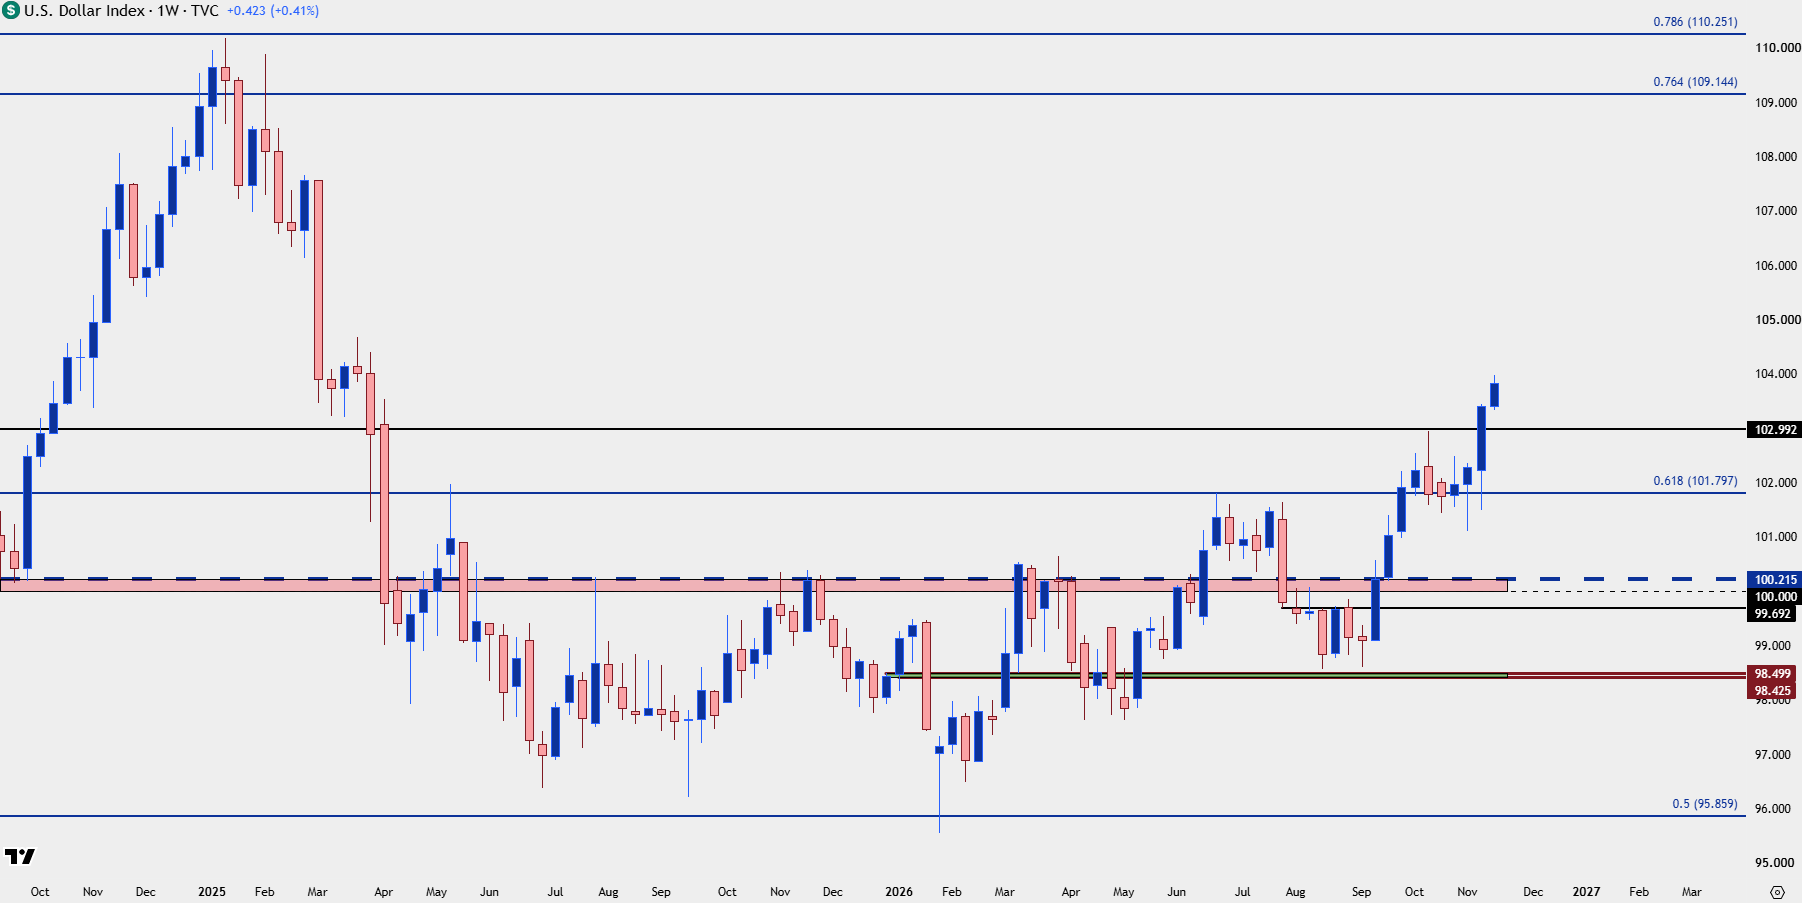
Chart prepared by James Stanley; data derived from Tradingview
EUR/USD
The fall in EUR/USD has been somewhat dramatic over the past few months, as the pair was setting up at the 1.1700 level just back in August and, already, sellers have prodded a 1.1000 break. Along the way, the pair went into oversold territory on the daily but that was just enough to pause the decline. As looked at in the webinar two weeks ago, the resistance hit at 1.1275 highlighted a strong response from sellers, and the mirror image of what that USD chart above showed.
Since then, EUR/USD has now dipped into oversold territory on the weekly chart. The last time this happened, January of 2025, price ultimately set a significant low. But as a case in point to the dangers of a lagging indicator like RSI, the prior instance saw the market repeatedly push into oversold during 2022, as sellers just continued to drive ahead.
EUR/USD Weekly Price Chart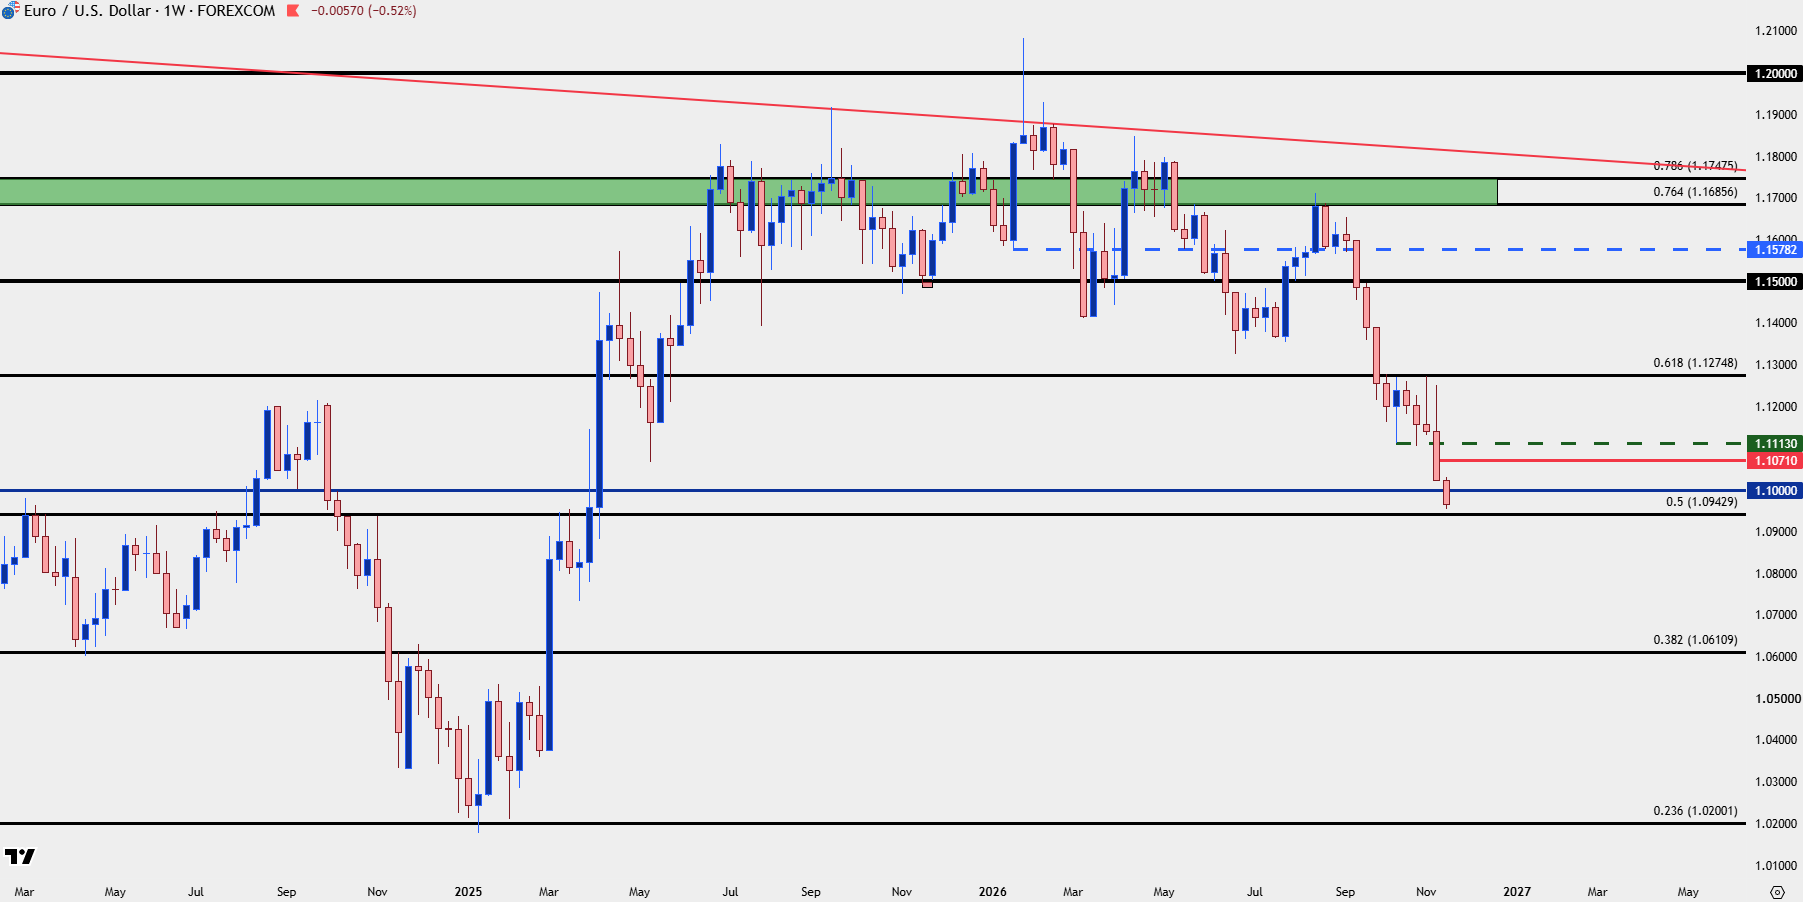
Chart prepared by James Stanley; data derived from Tradingview
EUR/USD Shorter-Term
I wrote about this on Thursday but surprisingly the 1.1000 level was unable to bring any lasting bids to the pair, and sellers just continued to drive until ultimately setting support around 1.0950.
From the four hour chart there’s now a descending triangle, which is a bearish formation, and this keeps the door open for sellers as we go into next week. If we do see a pullback, 1.1000 seems an opportune area to gauge response and 1.1071 and 1.1113 set up above that.
EUR/USD Four-Hour Chart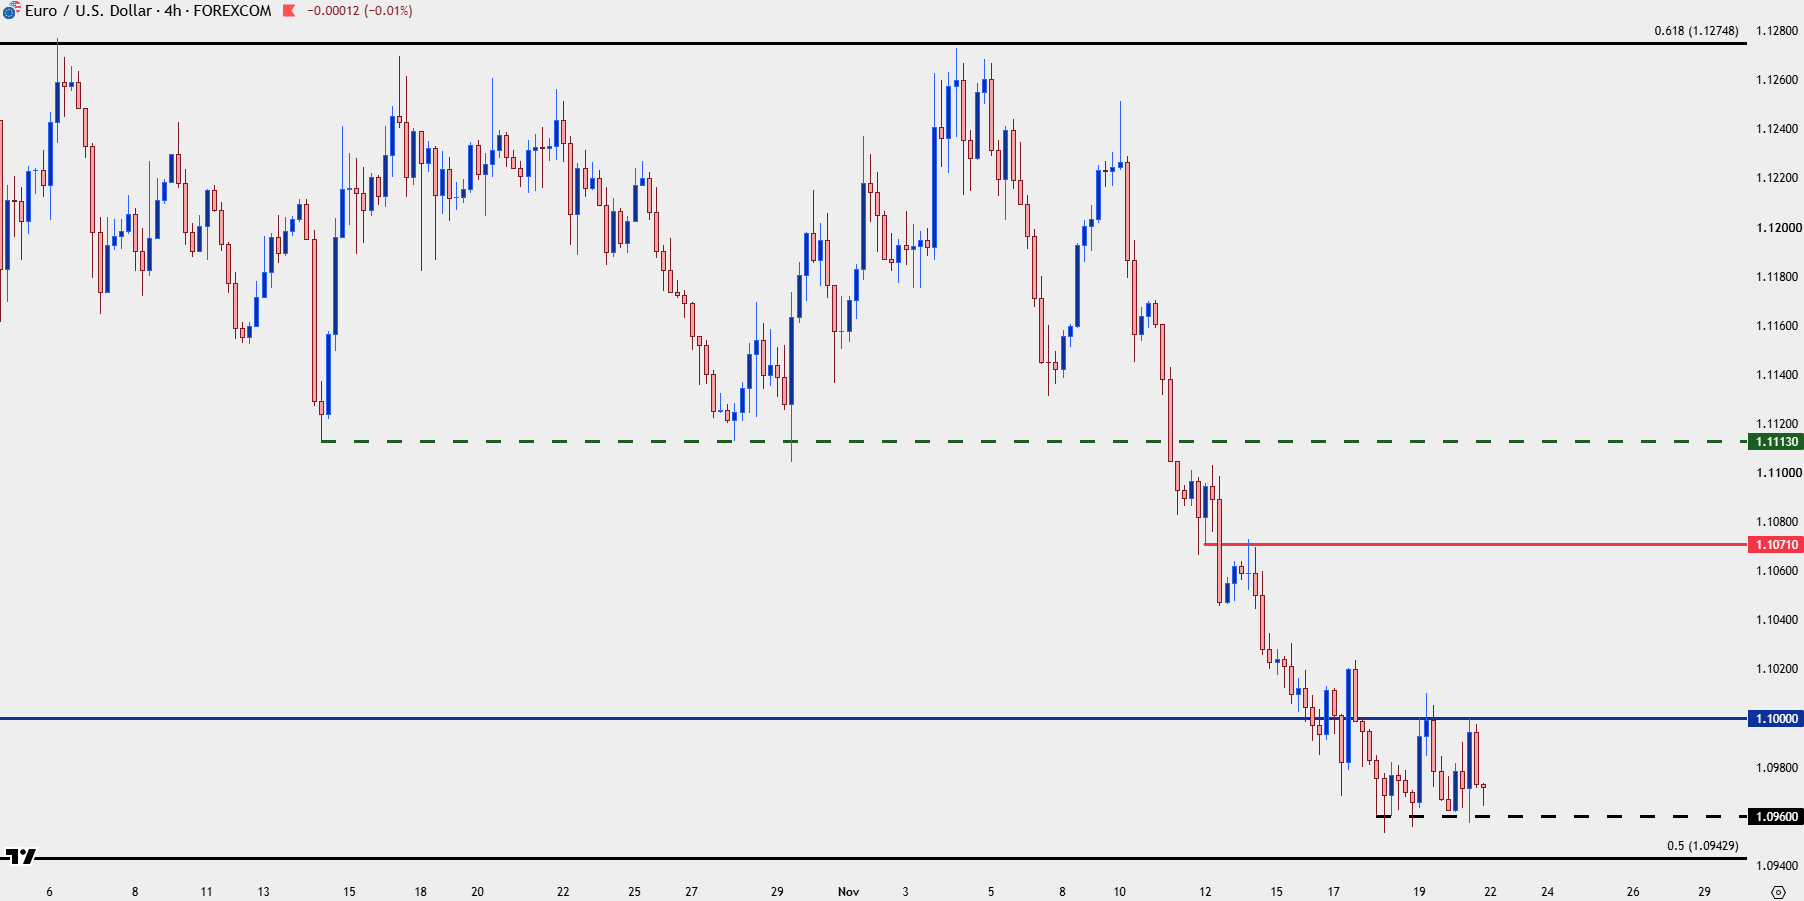
Chart prepared by James Stanley; data derived from Tradingview
GBP/USD
As looked at earlier this week, for USD-weakness themes, whether that’s pullback or reversal, GBP/USD seemed to be the cleanest shirt in the dirty laundry. But even that pair was unable to withstand the drive from Dollar bulls this week, and GBP/USD is now trading at a fresh yearly low.
At this point the weekly chart shows price at the bottom of the current bar and this is the kind of thing that keeps the door open for continuation as we go into next week.
As for support potential, the 1.3000 level stands out, but, realistically, we’re going to need to see a cooling in the current friction before that scenario can be entertained.
GBP/USD Weekly Price Chart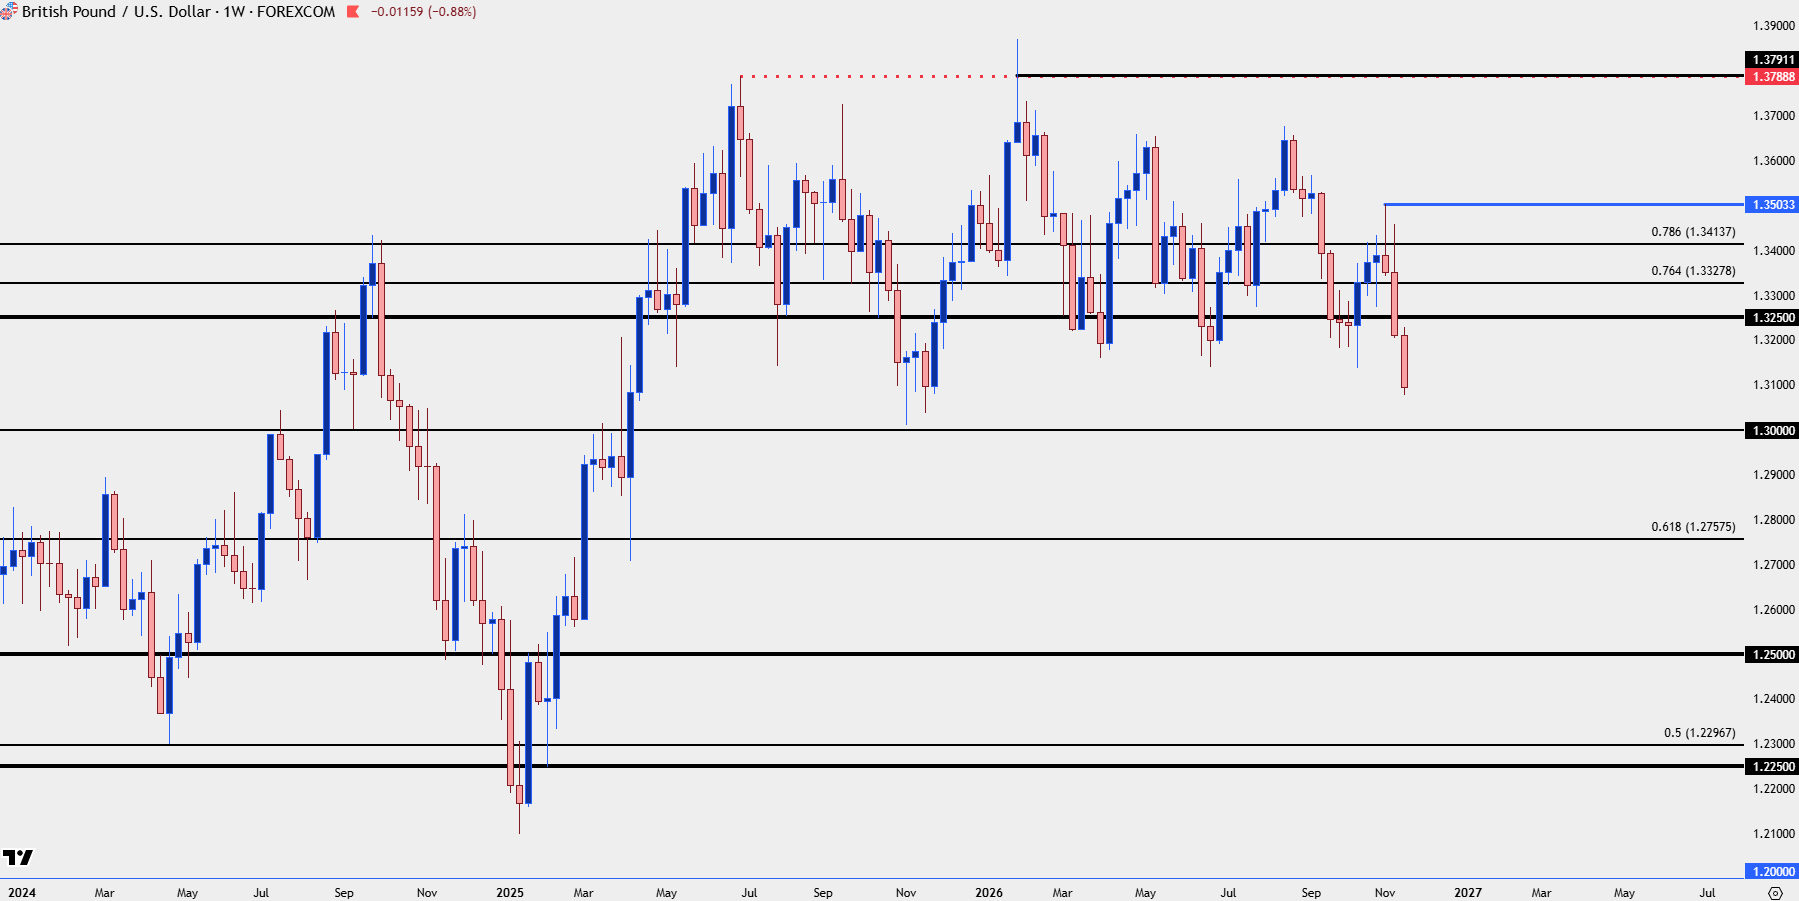
Chart prepared by James Stanley; data derived from Tradingview
USD/JPY
The late-week rally in bonds brought a sizable move into USD/JPY, and I had looked into the pair on Thursday after another test at the 160.00 handle.
The 158.68 level was the final ‘near-term’ support level that I had listed and, so far, that’s held the lows. This remains a key piece of the US Dollar puzzle and as I’ve been highlighting, a wider scale of carry unwind can create significant collateral damage elsewhere, such as stocks.
This also puts front and center the relationship, where a continued rally in bonds brings with it the potential for USD/JPY weakness, and if longer-term bulls that are still holding hedges decide to bail, that can add even more bearish pressure to the pair and, in essence, a global de-leveraging event that could quickly see risk capital evaporate from equity markets.
USD/JPY Daily Chart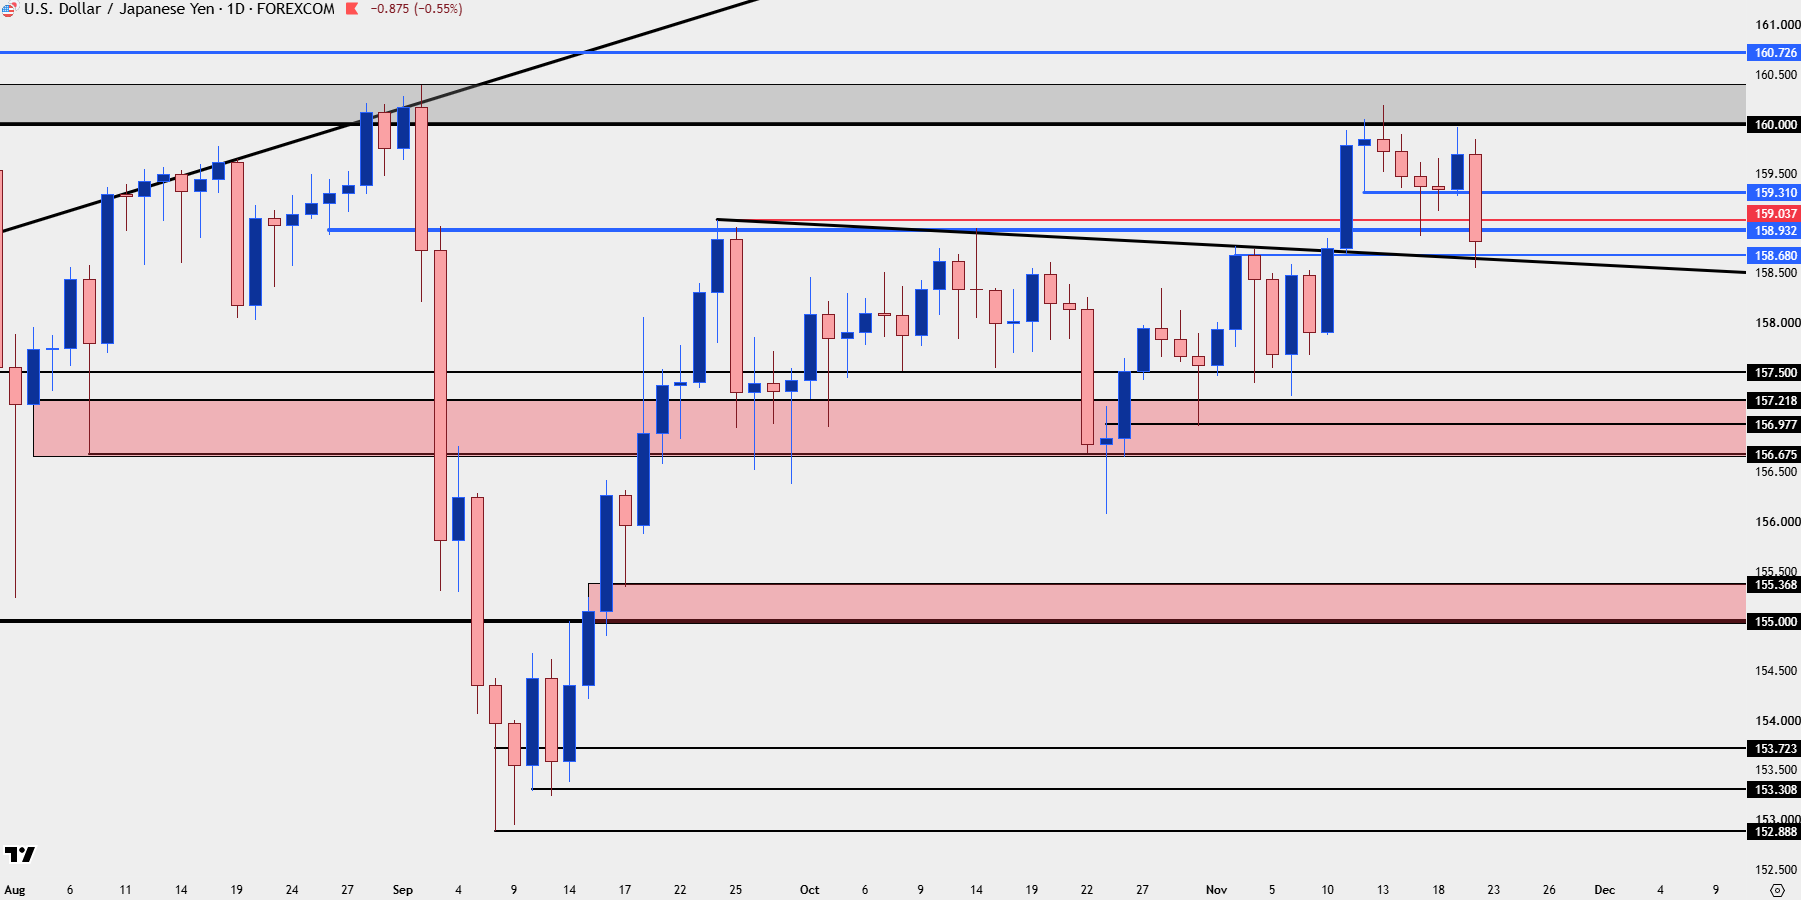
Chart prepared by James Stanley; data derived from Tradingview
--- written by James Stanley, Senior Market Analyst, Global Macro