
Since last week’s webinar we’ve seen quite a bit of change, and while numerous questions around the ceasefire that’s triggered much of that change in markets seems to be in question, the response in the USD has been much more clear cut.
As of this webinar the Dollar was down to the ‘s3’ support zone from last week, which is the same resistance that held the highs for the ascending triangle in February, fueling the breakout in early-March on the back of tensions in Iran. From last week’s webinar, the two USD-weakness setups of EUR/USD and GBP/USD have both rallied aggressively, with Sterling outpacing the Euro as highlighted by the EUR/GBP chart.
In the DXY basket, price is testing a key zone of support that spans from the Fibonacci level at 97.94 up to 98.01 – the same zone that held resistance two months ago ahead of the bullish breakout.
US Dollar Daily Price Chart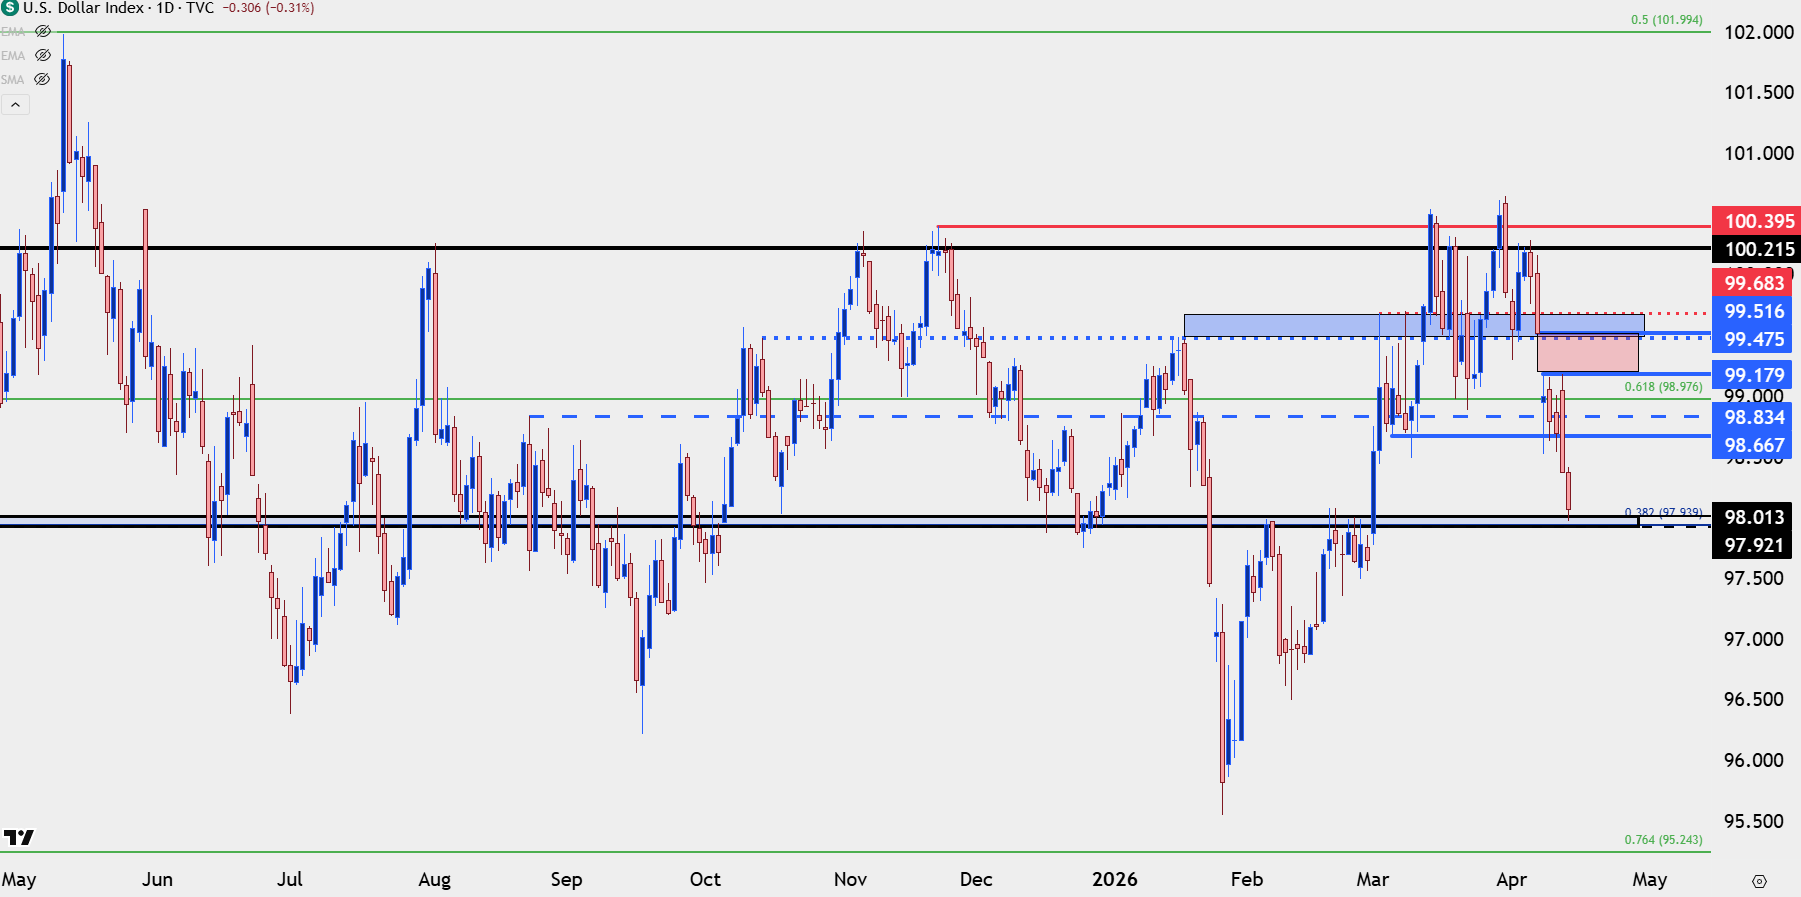
Chart prepared by James Stanley; data derived from Tradingview
EUR/USD
Last week started with EUR/USD testing the 1.1500 handle, which was also a possible higher-low above the prior week print at 1.1451 which, itself, was a higher-low above the March swing of 1.1411.
Now the pair is approximately three big figures higher with a test of the 1.1800 handle, and prior resistance of 1.1742-1.1766 is now an ‘s1’ zone of support. Below that, 1.1699 stands out as a possible ‘s2’ and the prior resistance, from 1.1628-1.1655 is the ‘s3’ zone on my radar for the rest of this week.
EUR/USD Four-Hour Chart
Chart prepared by James Stanley; data derived from Tradingview

GBP/USD
As looked at last week and the week before, GBP/USD had lagged behind EUR/USD in a couple of different ways. As EUR/USD was holding a higher-low in late-March, GBP/USD was setting a lower-low. But, the EUR/GBP chart was relevant as the cross pair had run into a resistance zone and, combined with the falling wedge in GBP/USD, there was an opening door to bullish breakout potential and the possibility that Cable could be more attractive than the Euro.
Last week finished with a 2.02% gain in GBP/USD against a 1.82% move in EUR/USD. And so far this week, GBP/USD has similarly outpaced the Euro which further speaks to that dynamic.
In the webinar, I looked at using shorter-terms to set up momentum strategies and there’s bigger picture support context in GBP/USD at 1.3484-1.3500 and then 1.3414-1.3434.
GBP/USD Daily Price Chart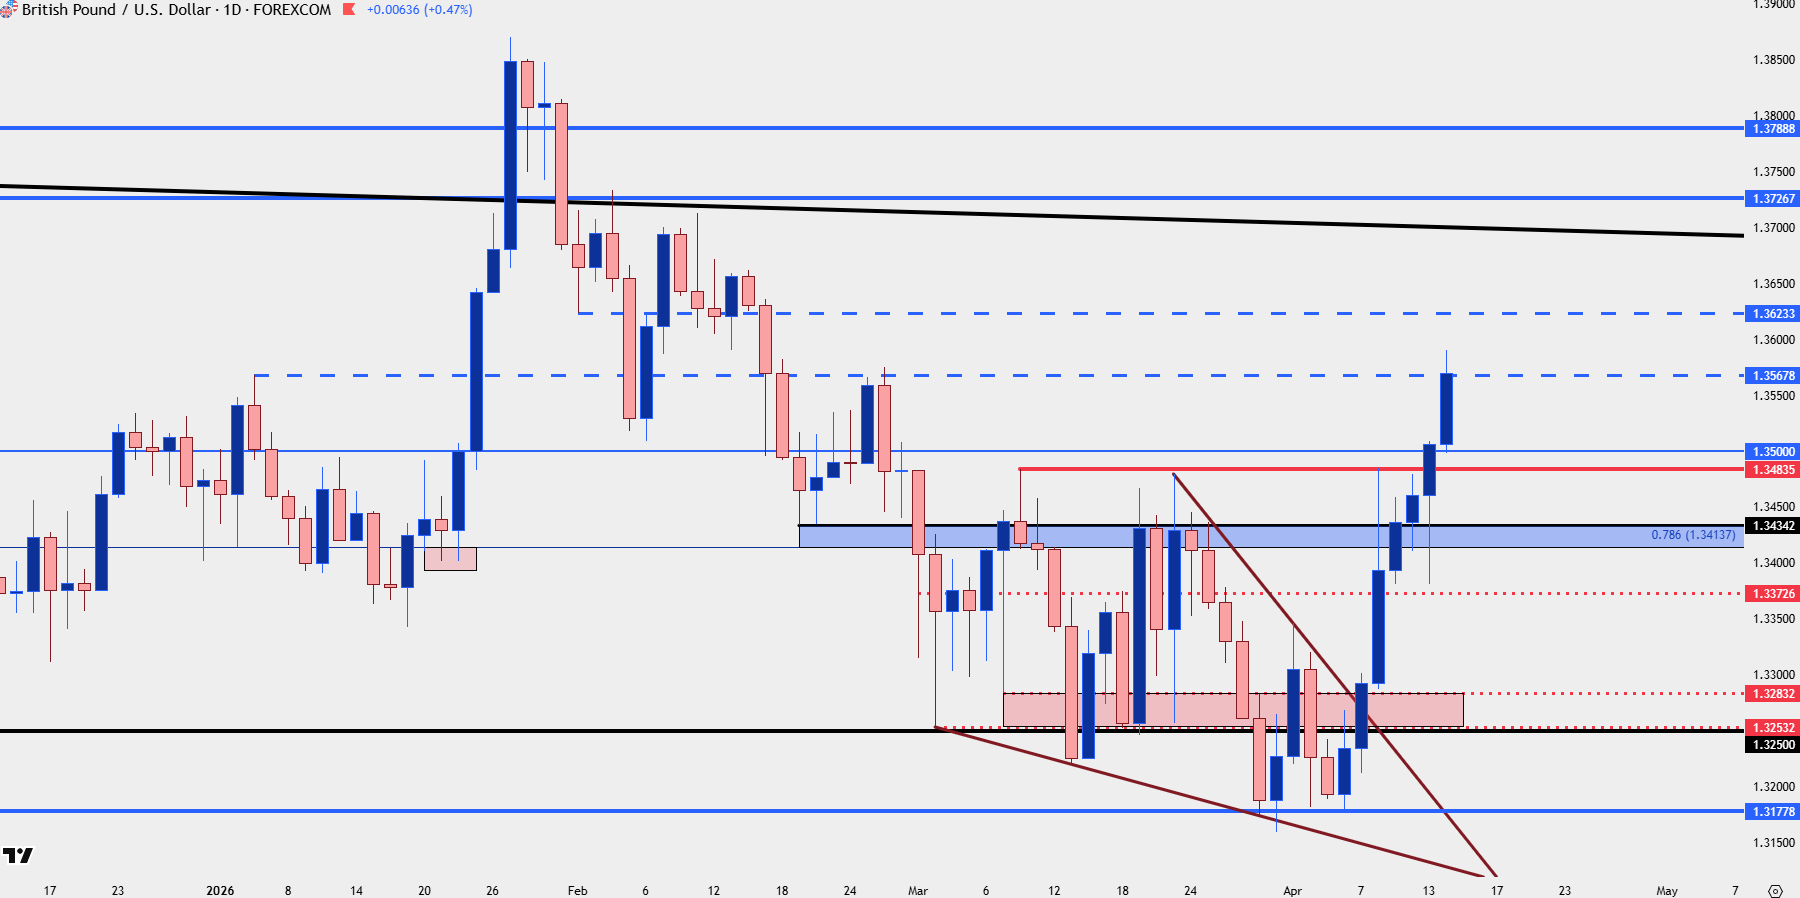
Chart prepared by James Stanley; data derived from Tradingview
USD/JPY
Considering the USD weakness in the above three charts, USD/JPY has held on incredibly well. This deductively points out how weak the Japanese Yen has been and if looking to fade USD-weakness, USD/JPY can set up a compelling option.
Also an option is to mesh the themes together and instead look for JPY weakness elsewhere, such as upside in EUR/JPY or GBP/JPY, as I had looked at in yesterday’s article or in today’s webinar.
USD/JPY Daily Chart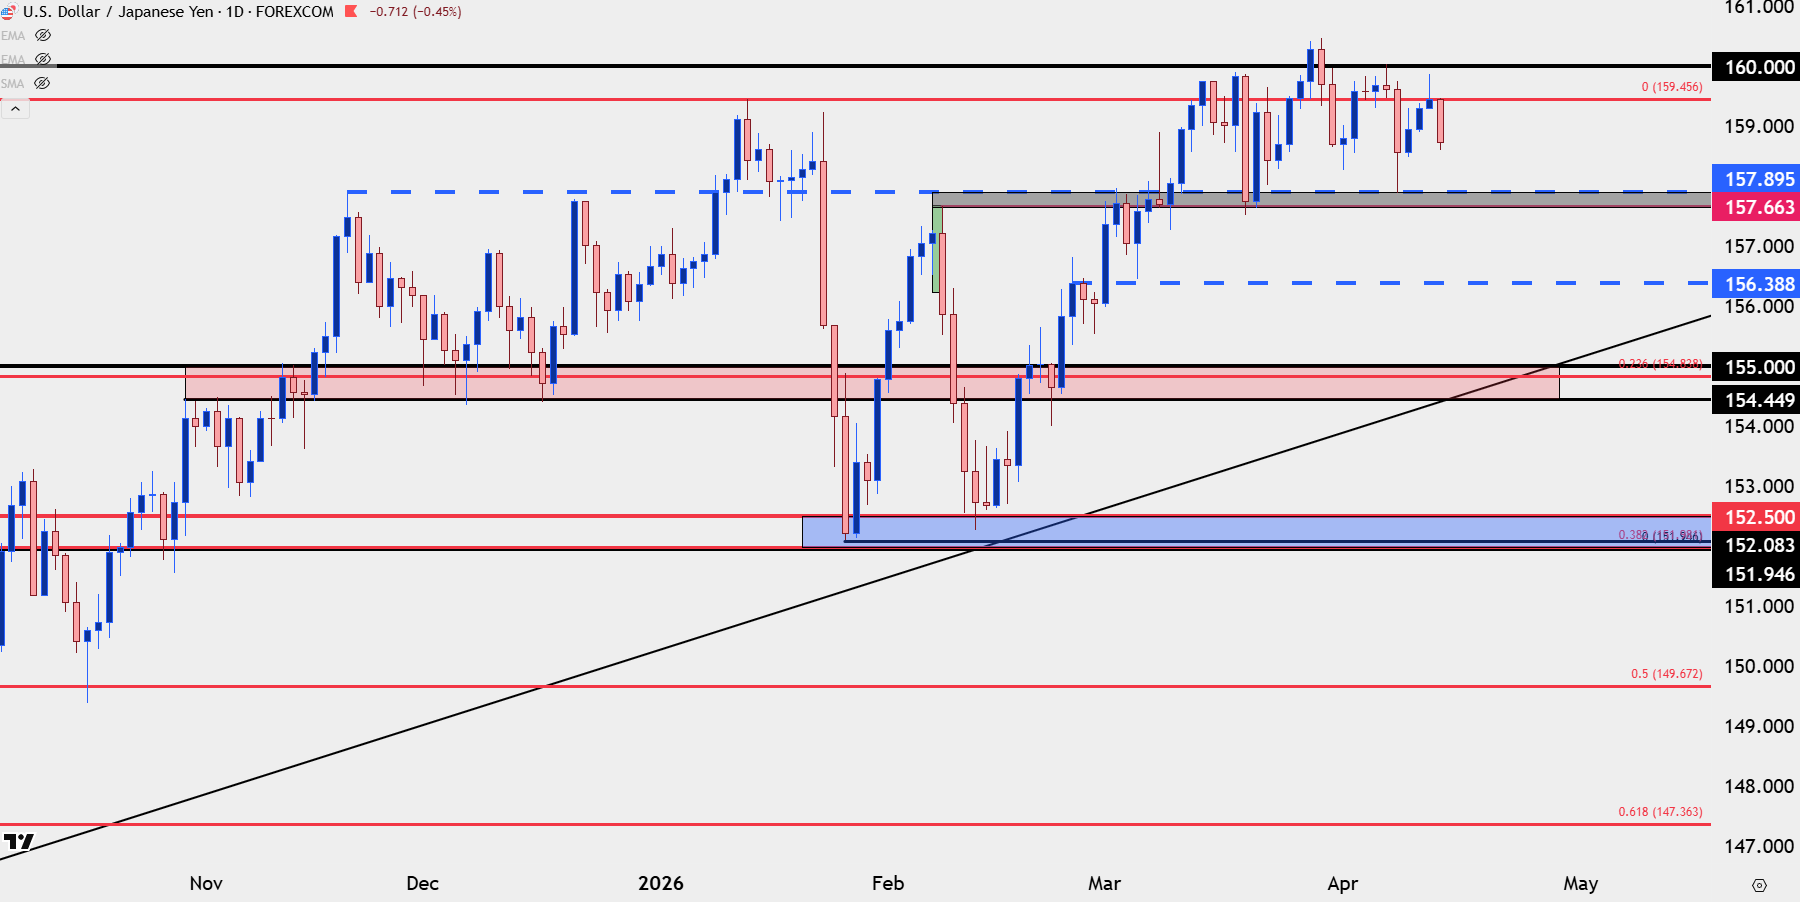
Chart prepared by James Stanley; data derived from Tradingview
EUR/GBP
One of the more unique aspects of spot FX is that it’s traded in pairs. And while many that dislike math may not enjoy that component of it, for those looking to impart strategy it can be beneficial as prevailing themes in majors can be extrapolated elsewhere, and vice versa.
I’ve tracked one such scenario in EUR/USD and GBP/USD over the past month, as late-March showed the Euro with relative strength against the British Pound, illustrated by the higher-low support hold in the former and the lower-low in the latter in late-March.
But as shown last week, EUR/GBP was up to a big area of resistance, and that could spell a shift in that dynamic to make GBP/USD as a more attractive venue for upside than EUR/USD – and that’s something that similarly spans into Yen-pairs that I’ll look at in a moment.
In EUR/GBP, that resistance has so far held as Sterling strength has come back into the equation and at this point, there’s the prospect of continued mean reversion in the cross.
EUR/GBP Daily Price Chart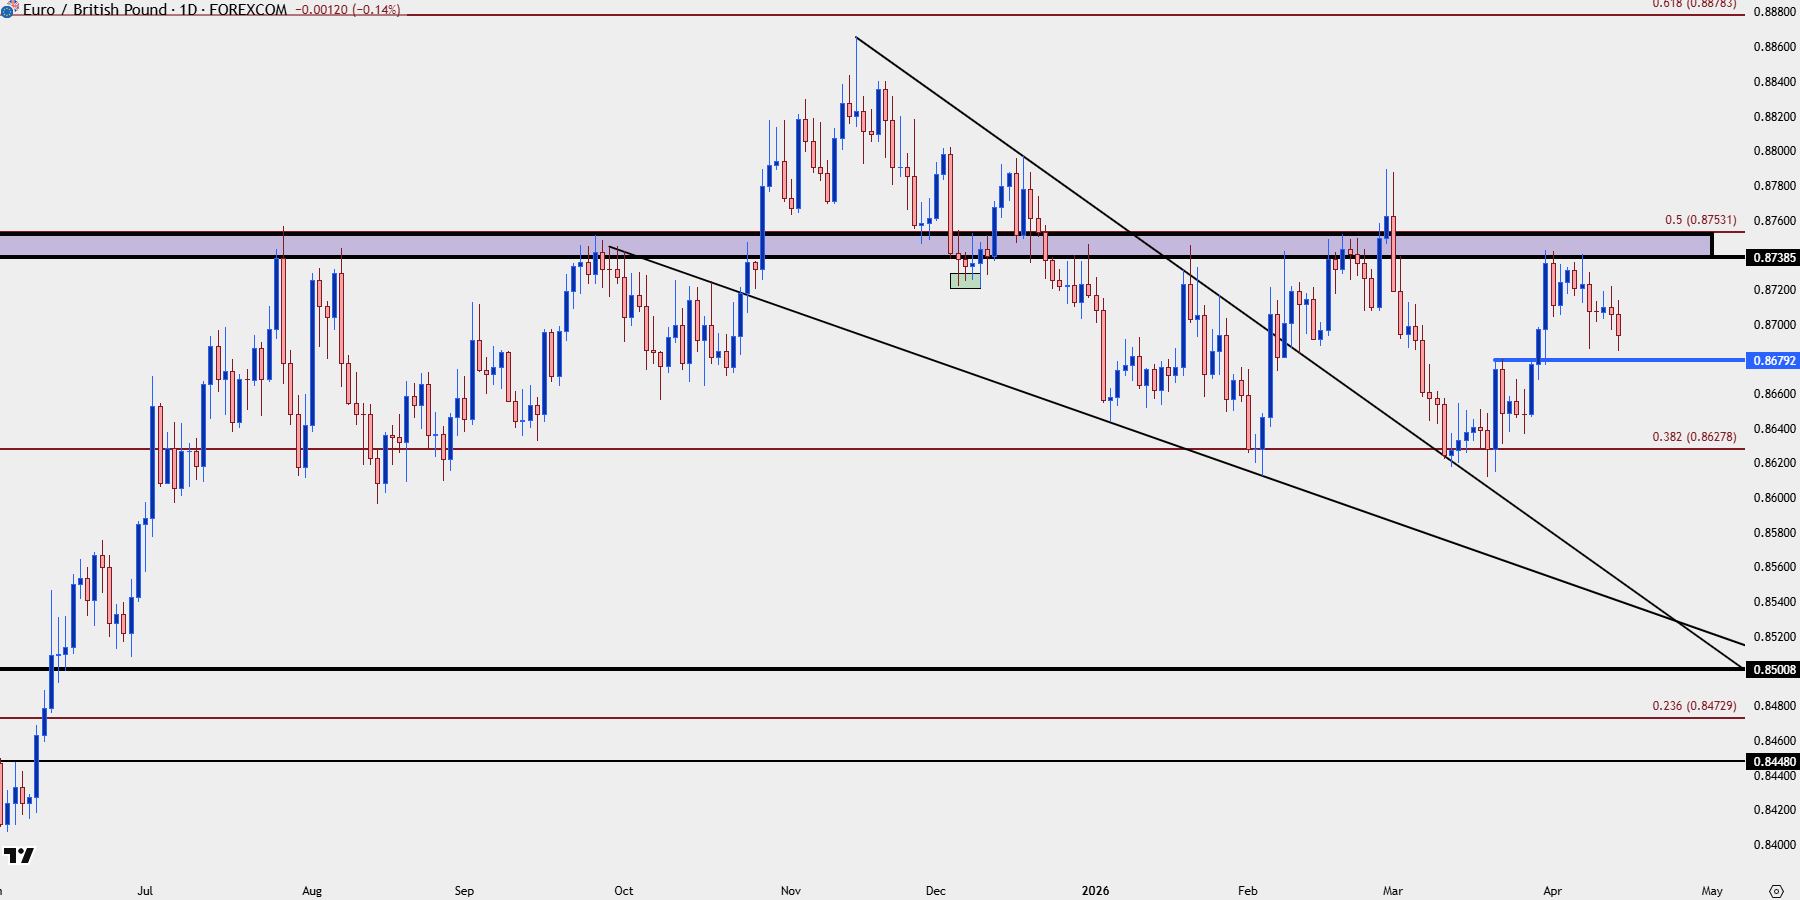
Chart prepared by James Stanley; data derived from Tradingview
EUR/JPY
Going along with that theme above of meshing together currencies based on prevailing trends and the relative Yen-weakness that’s allowed USD/JPY to hold up somewhat well combined with the Euro strength shown in EUR/USD breaking out – and that highlights a strong breakout in the EUR/JPY pair.
Previously the pair had built in a bull pennant formation and that started to give way last Monday. Since then, EUR/JPY has jumped up to a fresh all-time-high and with USD-weakness still in the backdrop, there’s the prospect of continuation in the EUR/JPY pair.
In the webinar, I looked at updated levels with initial support potential at prior resistance of 186.88 after which 186.22 and 185.55 stand out for support potential.
EUR/JPY Four-Hour Price Chart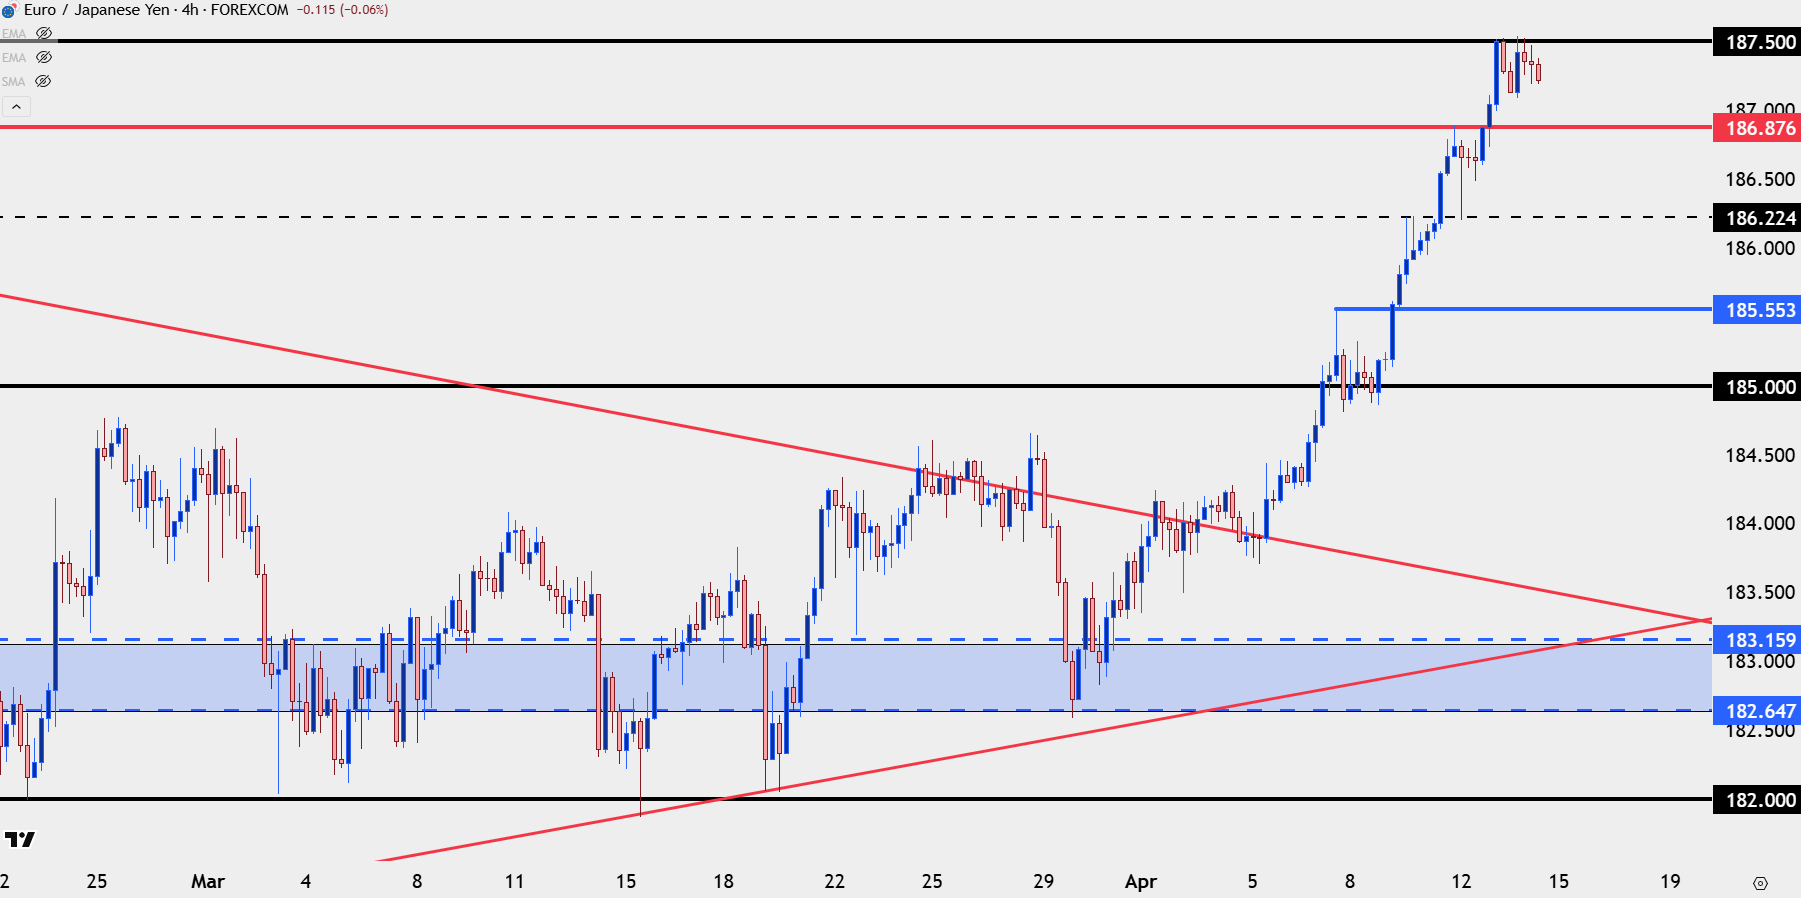
Chart prepared by James Stanley; data derived from Tradingview
GBP/JPY
There’s been a similar run of strength in GBP/JPY as the pair has rallied up to fresh 17-year highs. And like I had looked at above with GBP and Euro dynamics, the greater British Pound strength has shown against the Yen, as well. The 215 level now becomes a significant spot for support potential, but from longer-terms, it’s the 214.30 level that stands out as important, and then below that at 213.31 we have a prior swing high that hasn’t yet shown much for support potential.
GBP/JPY Four-Hour Chart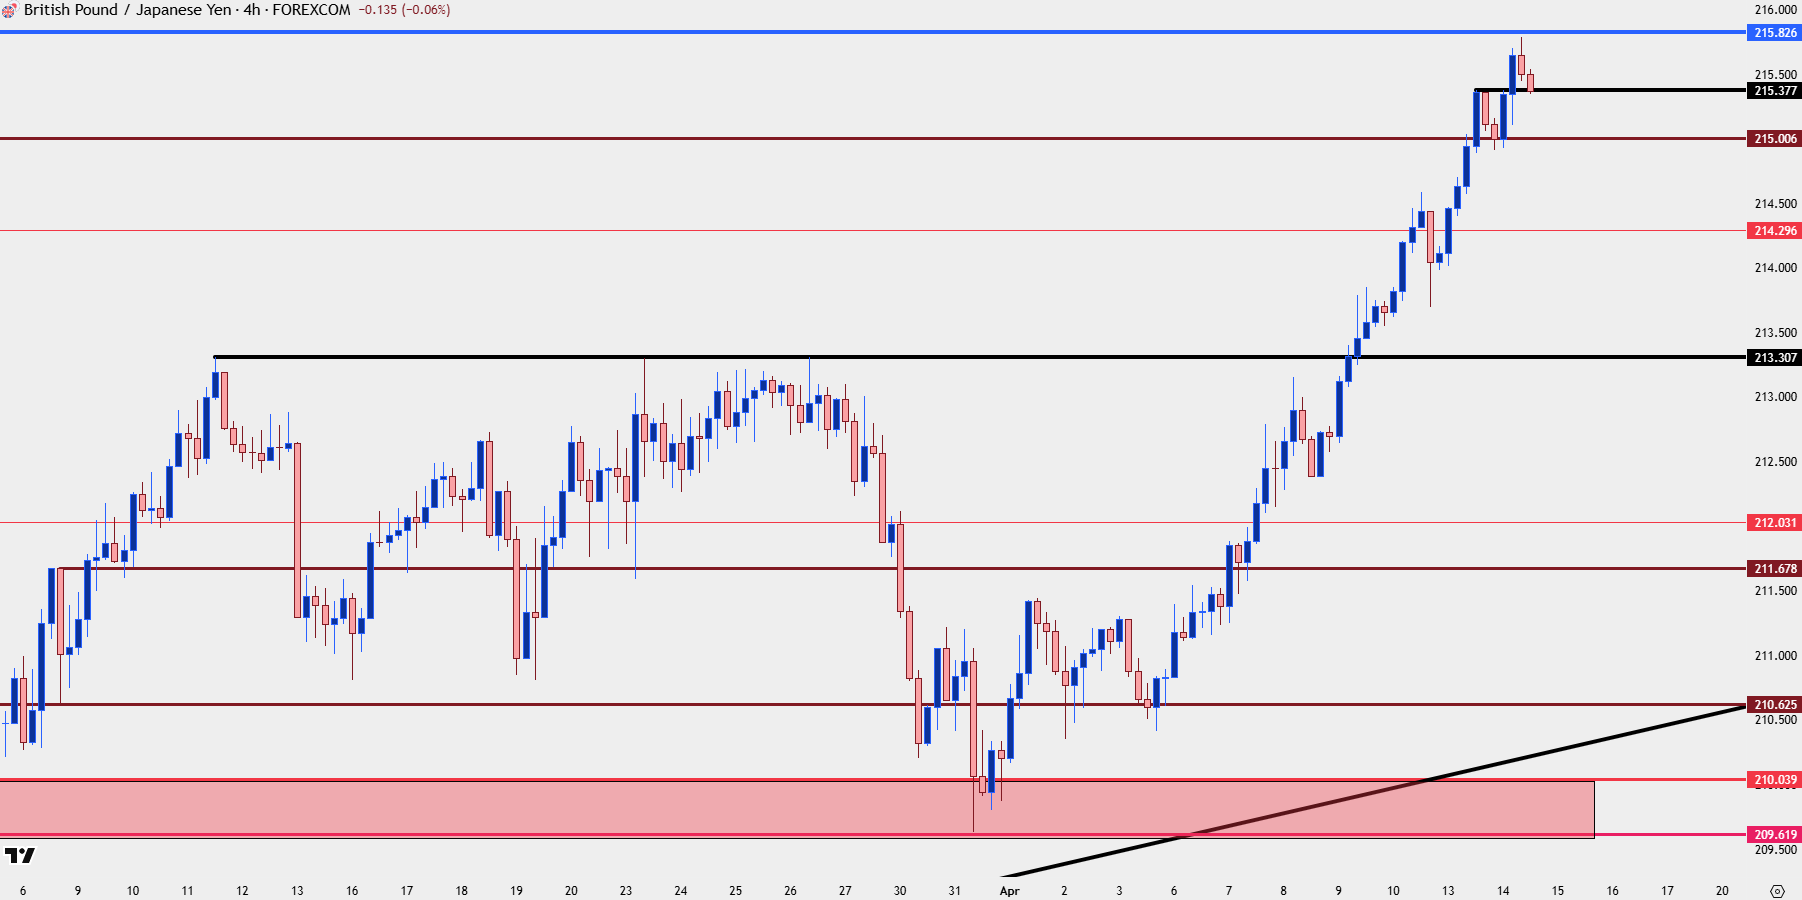
Chart prepared by James Stanley; data derived from Tradingview
--- written by James Stanley, Senior Market Analyst, Global Macro