



AUD/JPY and NZD/JPY looking good for longs!
AUD/JPY and NZD/JPY formed bullish engulfing candles today, trading to their highest levels since 2015.
Share this:

With the US Dollar Index (DXY) falling for the fourth straight day, commodities, such as Gold and Silver, are getting a bid today. Not to be outdone, commodity currencies, such as the Aussie and the Kiwi, are also moving higher! But it isn’t just vs the US Dollar. These two currencies are forming bullish engulfing candlestick patterns vs the Yen on the daily timeframe. With USD/JPY having pulled back in recent days, AUD/JPY and NZD/JPY are reaching their highest levels since 2015. Will it continue?
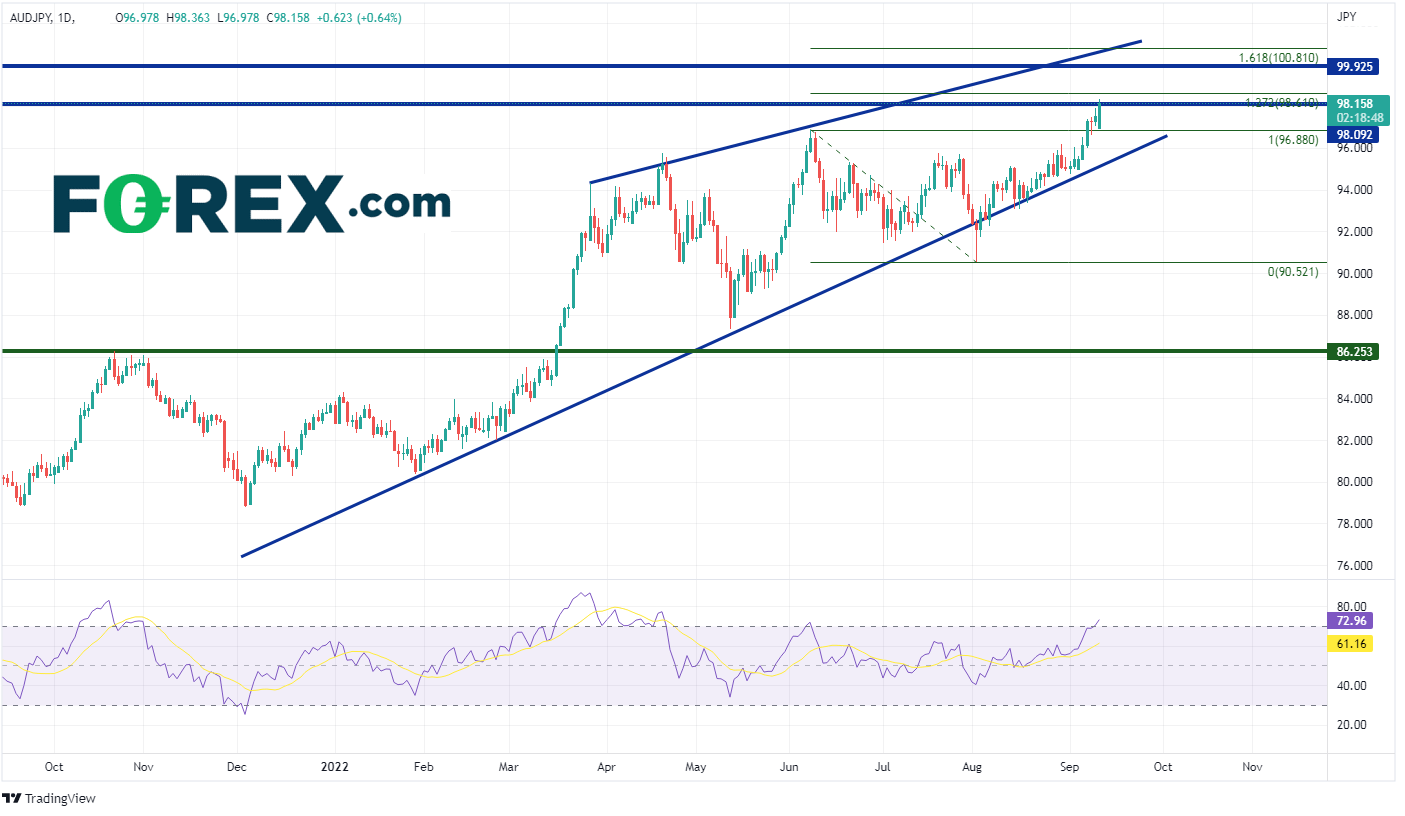
On a daily timeframe, AUD/JPY has been moving higher since its March 2020 lows near 62.77. However, on March 16th, the pair broke through resistance at 86.25 and the pair hasn’t looked back since. Just eight trading days later, the pair reached a high of 94.32! Over the last five months, the pair has continued to move higher in an ascending wedge formation. The expectation is that price will break lower out of an ascending wedge. However, AUD/JPY is trading in the middle of the wedge and has plenty of room to move higher before it reaches the top trendline. Price is currently trading at its highest level since January 2015, just above 98.09. First resistance is at the 127.2% Fibonacci extension from the high of June 8th to the lows of August 2nd near 98.61. Above there, price can move to horizontal resistance from December 2014 at 99.93, then the 161.8% Fibonacci extension from the previously mentioned timeframe at 100.81. However, notice that the RSI is in overbought territory, an indication that the pair may be ready for a pullback. First support is at the bottom trendline of the ascending wedge near 95.18. Below there, AUD/JPY can fall all the way to the lows of August 2nd at 90.52, then then the previously mentioned horizontal support at 86.35.
Source: Tradingview, Stone X
NZD/JPY has traded in a similar manner to AUD/JPY over the last 5 months. Although NZD/JPY had a nice couple of day in mid-March similar to that of AUD/JPY. It wasn’t until March 22nd that the pair broke through its previous high. On April 20th, NZD/JPY reached a high of 86.84 and pulled back aggressively to 79.45. Since then, the pair has been moving higher in a rising triangle. On September 8th, NZD/JPY finally took out the April highs. With today’s bullish engulfing candlestick, the NZD/JPY traded to its highest level since June 2015. First resistance is at the high of June 2015 at 89.11. Above there, resistance is at the 127.2% Fibonacci extension from the highs of April 20th to the lows of May 12th, at 89.49, and then the highs from the week of May 25th, 2015, at 89.95. First support is at the highs of August 12th, at 87.35. Below there, price can fall to the rising trendline of the triangle near 83.75 and then the lows of August 2nd (and previous resistance) near 82.31.

Source: Tradingview, Stone X
AUD/JPY and NZD/JPY formed bullish engulfing candles today, trading to their highest levels since 2015. For the moment, it looks like there is room for them to continue to move higher. However, if the Yen starts to strengthen or commodities begin to weaken (and therefore commodity currencies as well), the pairs could start to pull back.
With the US Dollar Index (DXY) falling for the fourth straight day, commodities, such as Gold and Silver, are getting a bid today. Not to be outdone, commodity currencies, such as the Aussie and the Kiwi, are also moving higher! But it isn’t just vs the US Dollar. These two currencies are forming bullish engulfing candlestick patterns vs the Yen on the daily timeframe. With USD/JPY having pulled back in recent days, AUD/JPY and NZD/JPY are reaching their highest levels since 2015. Will it continue?
On a daily timeframe, AUD/JPY has been moving higher since its March 2020 lows near 62.77. However, on March 16th, the pair broke through resistance at 86.25 and the pair hasn’t looked back since. Just eight trading days later, the pair reached a high of 94.32! Over the last five months, the pair has continued to move higher in an ascending wedge formation. The expectation is that price will break lower out of an ascending wedge. However, AUD/JPY is trading in the middle of the wedge and has plenty of room to move higher before it reaches the top trendline. Price is currently trading at its highest level since January 2015, just above 98.09. First resistance is at the 127.2% Fibonacci extension from the high of June 8th to the lows of August 2nd near 98.61. Above there, price can move to horizontal resistance from December 2014 at 99.93, then the 161.8% Fibonacci extension from the previously mentioned timeframe at 100.81. However, notice that the RSI is in overbought territory, an indication that the pair may be ready for a pullback. First support is at the bottom trendline of the ascending wedge near 95.18. Below there, AUD/JPY can fall all the way to the lows of August 2nd at 90.52, then then the previously mentioned horizontal support at 86.35.

Source: Tradingview, Stone X
Trade AUD/JPY now: Login or Open a new account!
• Open an account in the UK
• Open an account in Australia
• Open an account in Singapore
NZD/JPY has traded in a similar manner to AUD/JPY over the last 5 months. Although NZD/JPY had a nice couple of day in mid-March similar to that of AUD/JPY. It wasn’t until March 22nd that the pair broke through its previous high. On April 20th, NZD/JPY reached a high of 86.84 and pulled back aggressively to 79.45. Since then, the pair has been moving higher in a rising triangle. On September 8th, NZD/JPY finally took out the April highs. With today’s bullish engulfing candlestick, the NZD/JPY traded to its highest level since June 2015. First resistance is at the high of June 2015 at 89.11. Above there, resistance is at the 127.2% Fibonacci extension from the highs of April 20th to the lows of May 12th, at 89.49, and then the highs from the week of May 25th, 2015, at 89.95. First support is at the highs of August 12th, at 87.35. Below there, price can fall to the rising trendline of the triangle near 83.75 and then the lows of August 2nd (and previous resistance) near 82.31.

Source: Tradingview, Stone X
Trade NZD/JPY now: Login or Open a new account!
• Open an account in the UK
• Open an account in Australia
• Open an account in Singapore
AUD/JPY and NZD/JPY formed bullish engulfing candles today, trading to their highest levels since 2015. For the moment, it looks like there is room for them to continue to move higher. However, if the Yen starts to strengthen or commodities begin to weaken (and therefore commodity currencies as well), the pairs could start to pull back.
Learn more about forex trading opportunities.
Related tags:


The complete CFD trading experience
Award-winning platforms, competitive spreads, low commissions and dedicated support.
We live and breathe the markets and are dedicated to helping traders realise their ambitions as we continue to set the industry bar.
Economic calendar
Web Trader platform
Our sophisticated web-based platform is packed with features.
Related articles
Gold forecast: Rising yields become too hot for gold, but the outlook is far from bearish
Gold and silver prices took a plunge today, with the former down 3% and the latter falling some 5% by mid European session, before bouncing off their lows. The losses come after the metals remained largely supported until last week, despite the big dollar rally and surging bond yields as we have seen in recent weeks. But it simply got too much, and the metals succumbed to pressure today.

USD into a Massive Week as Yields Fly and Gold Breaks
It’s a huge week with PCE and NFP, but it’s what’s happening off of the calendar that demands attention with US yields flying to fresh multi-decade highs.


USDJPY Forecast Intervention Fears Clash with Dollar Strength
Recent trading sessions have produced mixed results for the Japanese yen. By the end of last week, USD/JPY had fallen by more than 1.00%, reflecting a modest recovery in the yen. However, the start of this week has seen the pair move slightly back in favor of the U.S. dollar, posting gains of around 0.04%.

StoneX Europe Ltd may make third party material available on this website which may contain information included but not limited to the conditions of financial markets. The material is for information purposes only and does not contain, and should not be construed as containing, investment advice and/or investment recommendation and/or an investment research and/or an offer of or solicitation for any transactions in financial instruments; any decision to enter into a specific transaction shall be made by the client following an assessment by him/her of their situation.
StoneX Europe Ltd makes no representation or warranty and assumes no liability as to the accuracy or completeness of the information provided, nor any loss arising from any investment based on a recommendation, forecast or other information supplied. You should always seek independent advice as to your suitability to speculate in any related markets and your ability to assume the associated risks, if you are at all unsure. We are not under any obligation to update any such material. Any opinion made may be personal to the author and may not reflect the opinion of StoneX Europe Ltd.