




AUDUSD The huge head and shoulders pattern that every FX trader is watching
AUD/USD is one of the most compelling technical setups to take advantage of the recent US dollar strength
Share this:

As we noted in yesterday’s analysis of EUR/USD, the US dollar has been on tear over the last month, reversing its trend of relative weakness over the previous three quarters.
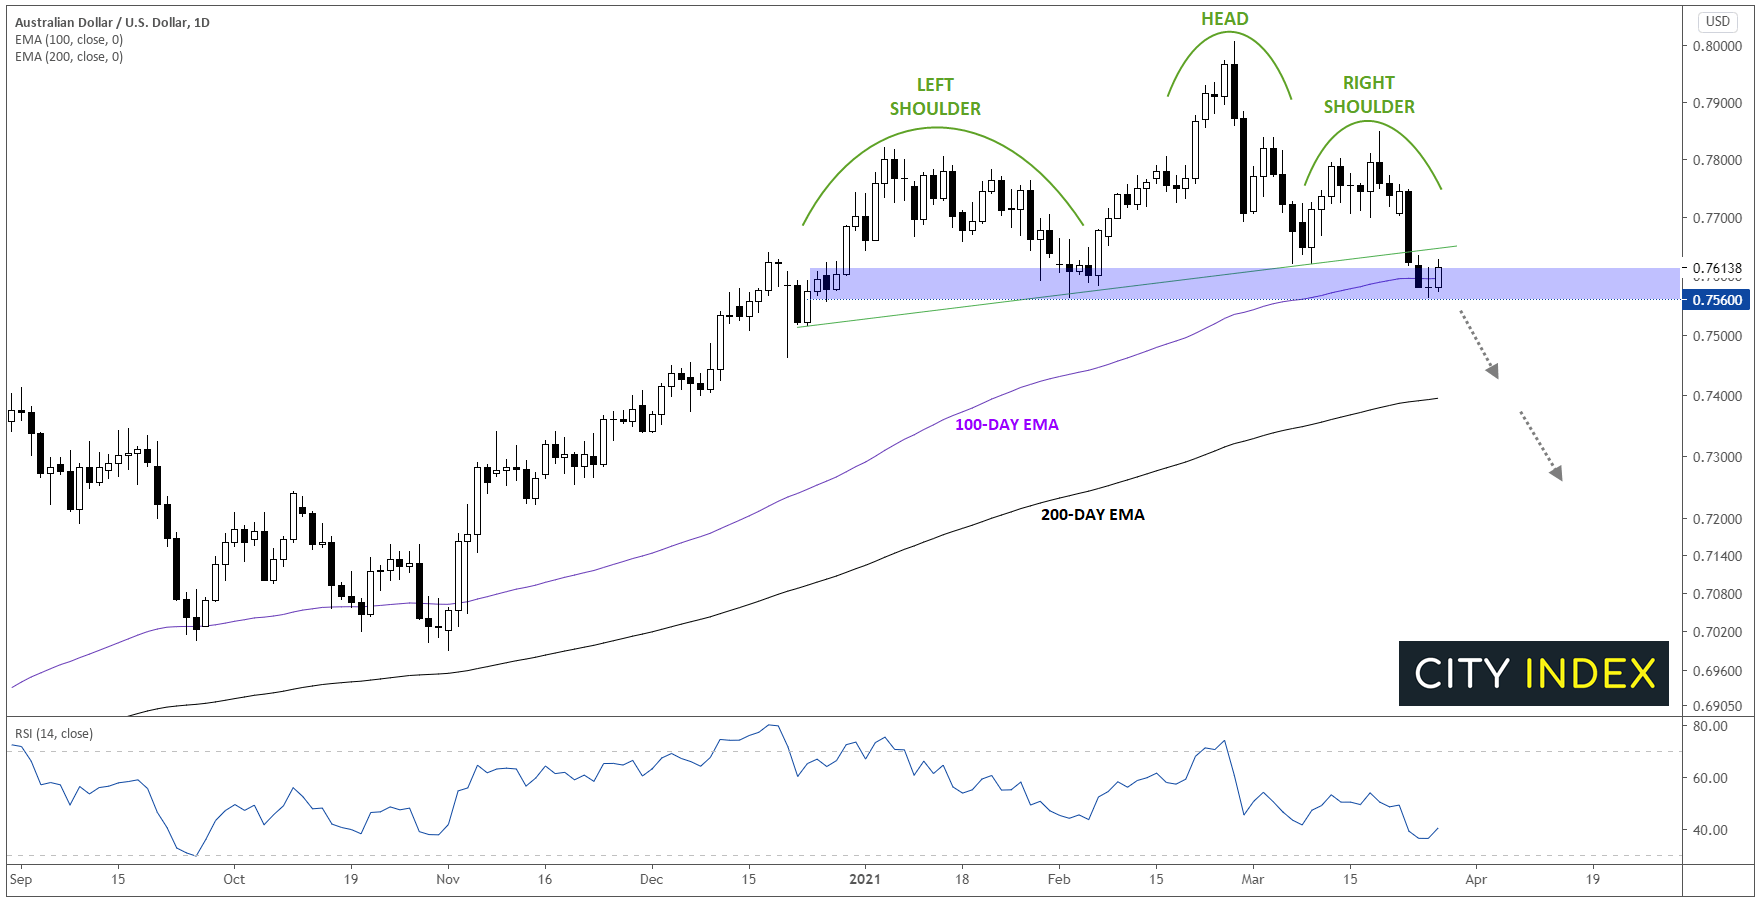
The recent moves have flipped the technical bias in favor of the greenback against most of her major rivals, but arguably the most compelling technical setup is in AUD/USD, which has carved out a huge head-and-shoulders pattern over the last three months. For the uninitiated, this classic pattern shows a shift from an uptrend (higher highs and higher lows) to a downtrend (lower lows and lower highs) and often marks a significant top in the chart.
The pattern is typically confirmed by a break below the “neckline”; in this case, the neckline can be represented either by the ascending trend line near 0.7650 (already broken) or the horizontal support level at 0.7560 (still intact). As the chart below shows, the 100-day EMA also comes in near 0.7600, providing another reason to monitor the 0.7560-0.7600 zone as a significant long-term area:
Source: StoneX, TradingView
For traders looking to short AUD/USD, one potential strategy would be to wait for rates to confirm the break below 0.7560 to enter a trade with a stop above 0.7600 or 0.7650 with targets at either the 200-day EMA near 0.7400 or even the head-and-shoulders pattern’s “measured move” objective in the lower 0.7000s. Meanwhile, if AUD/USD is able to hold support and rally above 0.7700, it would erase the near-term bearish bias
Key Australian and US data to watch in the coming week:
- Monday: n/a
- Tuesday: US Consumer Confidence
- Wednesday: US ADP Employment Report
- Thursday: AU Retail Sales, US ISM Manufacturing PMI
- Friday: US Non-Farm Payrolls
Learn more about forex trading opportunities.
As we noted in yesterday’s analysis of EUR/USD, the US dollar has been on tear over the last month, reversing its trend of relative weakness over the previous three quarters.
The recent moves have flipped the technical bias in favor of the greenback against most of her major rivals, but arguably the most compelling technical setup is in AUD/USD, which has carved out a huge head-and-shoulders pattern over the last three months. For the uninitiated, this classic pattern shows a shift from an uptrend (higher highs and higher lows) to a downtrend (lower lows and lower highs) and often marks a significant top in the chart.
The pattern is typically confirmed by a break below the “neckline”; in this case, the neckline can be represented either by the ascending trend line near 0.7650 (already broken) or the horizontal support level at 0.7560 (still intact). As the chart below shows, the 100-day EMA also comes in near 0.7600, providing another reason to monitor the 0.7560-0.7600 zone as a significant long-term area:
Source: StoneX, TradingView
For traders looking to short AUD/USD, one potential strategy would be to wait for rates to confirm the break below 0.7560 to enter a trade with a stop above 0.7600 or 0.7650 with targets at either the 200-day EMA near 0.7400 or even the head-and-shoulders pattern’s “measured move” objective in the lower 0.7000s. Meanwhile, if AUD/USD is able to hold support and rally above 0.7700, it would erase the near-term bearish bias
Key Australian and US data to watch in the coming week:
- Monday: n/a
- Tuesday: US Consumer Confidence
- Wednesday: US ADP Employment Report
- Thursday: AU Retail Sales, US ISM Manufacturing PMI
- Friday: US Non-Farm Payrolls
Learn more about forex trading opportunities.
Related tags:
Latest market news



The complete CFD trading experience
Award-winning platforms, competitive spreads, low commissions and dedicated support.
We live and breathe the markets and are dedicated to helping traders realise their ambitions as we continue to set the industry bar.
Economic calendar
Web Trader platform
Our sophisticated web-based platform is packed with features.
Related articles
S&P 500 forecast: Stocks extend drop as correction risks grow
US and global equity markets have extended Wednesday’s sell-off, with Wall Street opening lower after a weak handover from Asia and Europe. The deterioration in risk appetite has been spreading across global markets. The dollar was firmer, Treasury yields were holding onto yesterday’s gains, while gold, silver and bitcoin were all under pressure alongside equities and major currencies.
Gold forecast: XAU/USD could take a larger dive after the big rise in yields
Gold prices have been falling in the last few days after last week’s post-FOMC pop faded amid rising interest rate expectations, higher oil prices and a strengthening US dollar. As before, I wasn’t convinced gold would thrive in the current macro backdrop.

USD/JPY outlook: Hawkish Fed recalibration pressures the yen
Stronger US growth momentum and rising Treasury yields are keeping USD/JPY pointed higher, even as Japanese policymakers try to limit the pressure building across domestic markets.

StoneX Europe Ltd may make third party material available on this website which may contain information included but not limited to the conditions of financial markets. The material is for information purposes only and does not contain, and should not be construed as containing, investment advice and/or investment recommendation and/or an investment research and/or an offer of or solicitation for any transactions in financial instruments; any decision to enter into a specific transaction shall be made by the client following an assessment by him/her of their situation.
StoneX Europe Ltd makes no representation or warranty and assumes no liability as to the accuracy or completeness of the information provided, nor any loss arising from any investment based on a recommendation, forecast or other information supplied. You should always seek independent advice as to your suitability to speculate in any related markets and your ability to assume the associated risks, if you are at all unsure. We are not under any obligation to update any such material. Any opinion made may be personal to the author and may not reflect the opinion of StoneX Europe Ltd.