



Barratt Developments Closes 3 Higher As H1 Results Impress
Barratt Developments H1 revenue increased an impressive 6.3% to £2.3 billion as higher completions offset lower average price.
Share this:

Barratt Developments H1 revenue increased an impressive 6.3% to £2.3 billion reflecting an increase in completions whilst offsetting a lower average selling price.
Total completions rose 9.1% in H1, up from 3.7% the previous year. The average selling price declined -0.9%. When you strip out London, the average selling price actually increase 2.6%.
Total completions rose 9.1% in H1, up from 3.7% the previous year. The average selling price declined -0.9%. When you strip out London, the average selling price actually increase 2.6%.
Favourable times
Recent times have been favourable for housebuilders. Interest rates continue at historically low levels, which supports mortgage affordability. Mortgage approvals hit a 29-month high this month. Then let’s not forget, the UK’s well documented housing shortage which keeps demand bubbling. Add into the mix the government’s extremely successful help to buy scheme and it’s easy to why house builders have done so well across 2019. Barratt’s share price has soared 55% over the past year.
But the story doesn’t end there. There has been plenty of upbeat talk surrounding the housebuilders following the decisive Conservative win in the December election. The improved political landscape could unleash a mass of pent up demand, with rebounding confidence expected to drive volumes. Crucially it also means that the Help to Buy scheme will remain in its current for another 2 years. The share price has jumped 20% since the election.
Confidence in outlook
The key now, will be seeing how the post-election bounce continues going forward and whether it can be sustained. Barratt Developments demonstrated its confidence by extending the capital return plan for another year. Special returns of £175 million are anticipated for both November 2020 and 2021, in addition to normal dividend awards.
Trading in January was also encouraging with sales per site up 12%, prompting speculation that Barratt’s could be on track for the upper end of its full year growth of 3% -5%.
Chart thoughts
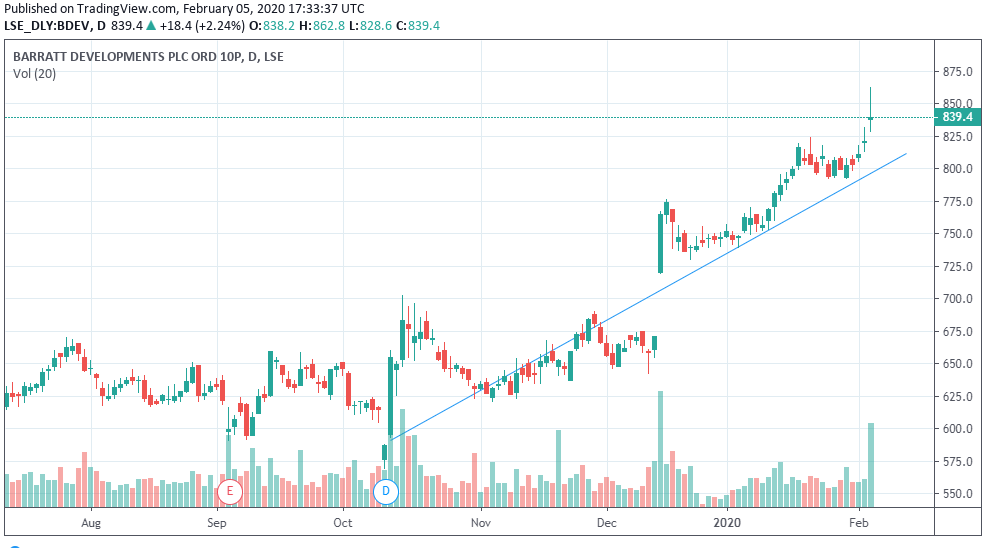
Barratt Development trades above its 200, 100 and 50 sma on a clearly bullish chart. It has just edged into overbought territory according to the relative strength index, so a slight pull back could be on the cards before gains are extended.
Barratt Developments H1 revenue increased an impressive 6.3% to £2.3 billion reflecting an increase in completions whilst offsetting a lower average selling price.
Total completions rose 9.1% in H1, up from 3.7% the previous year. The average selling price declined -0.9%. When you strip out London, the average selling price actually increase 2.6%.
Total completions rose 9.1% in H1, up from 3.7% the previous year. The average selling price declined -0.9%. When you strip out London, the average selling price actually increase 2.6%.
Favourable times
Recent times have been favourable for housebuilders. Interest rates continue at historically low levels, which supports mortgage affordability. Mortgage approvals hit a 29-month high this month. Then let’s not forget, the UK’s well documented housing shortage which keeps demand bubbling. Add into the mix the government’s extremely successful help to buy scheme and it’s easy to why house builders have done so well across 2019. Barratt’s share price has soared 55% over the past year.
But the story doesn’t end there. There has been plenty of upbeat talk surrounding the housebuilders following the decisive Conservative win in the December election. The improved political landscape could unleash a mass of pent up demand, with rebounding confidence expected to drive volumes. Crucially it also means that the Help to Buy scheme will remain in its current for another 2 years. The share price has jumped 20% since the election.
Confidence in outlook
The key now, will be seeing how the post-election bounce continues going forward and whether it can be sustained. Barratt Developments demonstrated its confidence by extending the capital return plan for another year. Special returns of £175 million are anticipated for both November 2020 and 2021, in addition to normal dividend awards.
Trading in January was also encouraging with sales per site up 12%, prompting speculation that Barratt’s could be on track for the upper end of its full year growth of 3% -5%.
Chart thoughts
Barratt Development trades above its 200, 100 and 50 sma on a clearly bullish chart. It has just edged into overbought territory according to the relative strength index, so a slight pull back could be on the cards before gains are extended.
Related tags:
Latest market news




The complete CFD trading experience
Award-winning platforms, competitive spreads, low commissions and dedicated support.
We live and breathe the markets and are dedicated to helping traders realise their ambitions as we continue to set the industry bar.
Economic calendar
Web Trader platform
Our sophisticated web-based platform is packed with features.
Related articles

SK Hynix IPO: Everything You Need to Know About SK Hynix
Learn everything you need to know about the SK Hynix IPO, including its Nasdaq listing, valuation, financials, ownership, competitors and investment risks.


european market open trump china tariffs fed outlook gold dax rebound
European equities opened firmer on Monday as Trump’s softer weekend comments toward China eased trade fears and lifted sentiment after last week’s sharp sell-off. Gold hit a new record above $4,000/oz as safe-haven demand persisted, while oil rebounded modestly. Investors focus on the upcoming earnings deluge and Powell’s Tuesday speech amid the US shutdown. Asian trade was mixed, with China’s exports surprising to the upside and Japan closed for a holiday.

dax breakout apac markets chip tensions fed cuts gold oil forex
APAC equities softened following Wall Street’s pullback, while the DAX confirmed a breakout from a multi-month triangle, extending its bullish trend above key EMAs. China’s crackdown on NVIDIA chip imports and renewed US tariff rhetoric weighed on tech sentiment. Brent fell below $65 as the Gaza ceasefire eased geopolitical pressure, while gold steadied around $3,970/oz. Traders eye US CPI release timing amid the shutdown and the start of Q3 earnings season.
StoneX Europe Ltd may make third party material available on this website which may contain information included but not limited to the conditions of financial markets. The material is for information purposes only and does not contain, and should not be construed as containing, investment advice and/or investment recommendation and/or an investment research and/or an offer of or solicitation for any transactions in financial instruments; any decision to enter into a specific transaction shall be made by the client following an assessment by him/her of their situation.
StoneX Europe Ltd makes no representation or warranty and assumes no liability as to the accuracy or completeness of the information provided, nor any loss arising from any investment based on a recommendation, forecast or other information supplied. You should always seek independent advice as to your suitability to speculate in any related markets and your ability to assume the associated risks, if you are at all unsure. We are not under any obligation to update any such material. Any opinion made may be personal to the author and may not reflect the opinion of StoneX Europe Ltd.