






Bitcoin is Finished US Dollar says otherwise
If traders believe that DXY will continue to act as a leading indicator for Bitcoin, they should expect Bitcoin to bounce.
Share this:

China has been on a rampage trying to crackdown on cryptocurrencies, threatening banks and miners throughout the country. Over this past weekend, China ordered domestic banks and payment platforms to stop provides services linked to trading of virtual currencies. As a result, Bitcoin has been selling off on fears that future of currency may not be Bitcoin, but rather simply digital fiat currencies. However, China isn’t the only one spreading fear into crypto HODLers. An Elon Musk tweet can send Bitcoin in either direction, depending on how he feels that day. The US government retrieved ransom Bitcoin, which until this point, was thought to be untraceable. In addition, more and more government officials in the US and around the world are calling for regulation of cryptos (governments always way their piece of your money!).
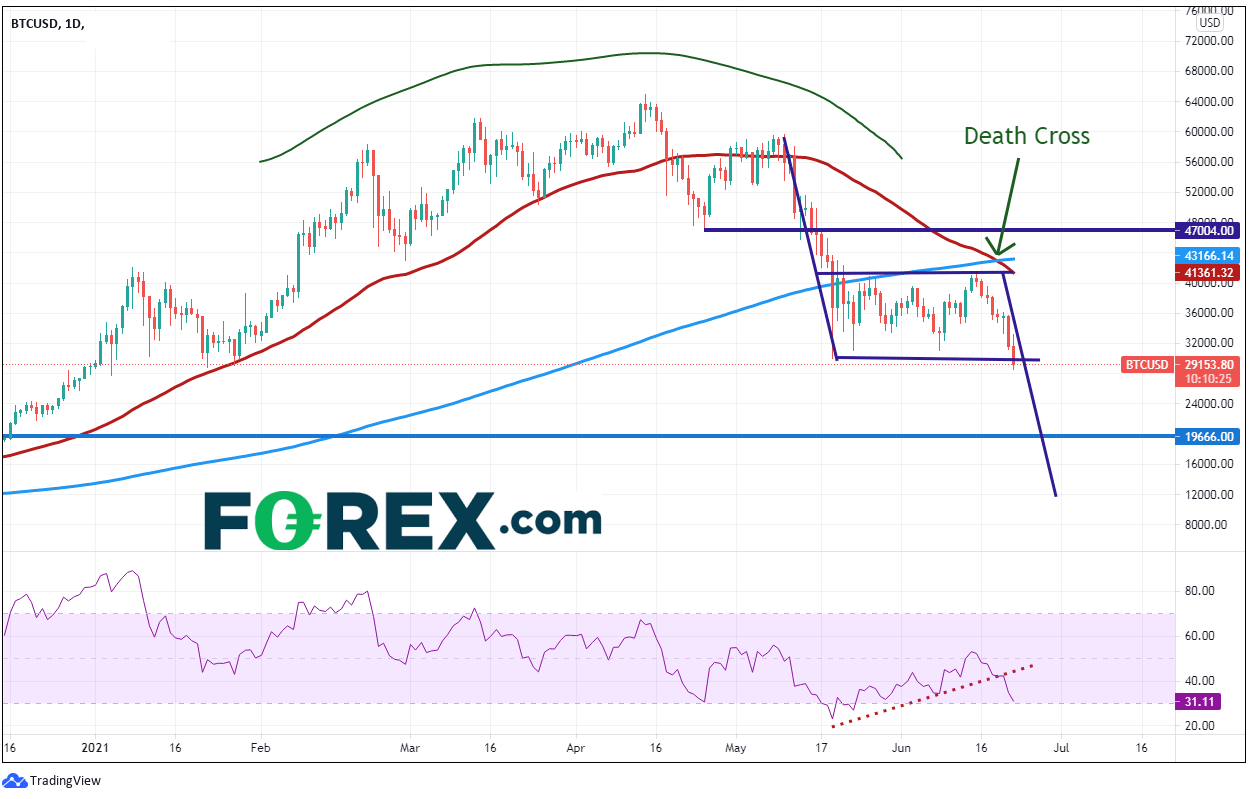
So, Bitcoin is moving lower. In February, Bitcoin began forming a rounding top formation and reached its all-time high on April 14th at 64895.22, which happened to be the same day as the Coinbase IPO (coincidence?). On May 10th, the cryptocurrency started to sell off aggressively and stalled near 30,000. Bitcoin consolidated in a flag pattern from May 10th to June 22nd between 30,066 and 41,341. On June 19th, the 50 Day Moving Average crossed below the 200 Day Moving Average forming a “Death Cross”, which as the name may imply, is a bearish signal. Today, price broke below the 30,066 lows and the bottom of the flag. The target of a flag pattern is the length of the flag poll added to the breakdown point from the flag, which in this case targets near 11,500.
Source: Tradingview, City Index
If we overlay a chart of DXY (blue line) on a chart of Bitcoin, it appears that the US Dollar Index has been leading BTC since February. Price in DXY formed 3 higher highs ahead of Bitcoin. The US Dollar then began moving lower on March 30th, ahead of the Bitcoin selloff which began in April 14th. DXY bottomed on May 25th and began moving higher, with a breakout on June 16th (FOMC). The US Dollar Index traced to the 61.8% Fibonacci retracement level from the March 31st highs to the May 25th lows, near 92.00. If traders expect this relationship to continue, BTC may be in for an aggressive bounce soon. It’s difficult to determine where BTC may bounce to if it is following DXY, as we don’t yet know if today’s low is going to be the low to measure from. However, if we assume it is, the 61.8% Fibonacci retracement in Bitcoin from the April 14th highs to today’s lows is near 51,030!
Source: Tradingview, City Index
Everything you wanted to know about DXY
BTC by itself points to a continued selloff to near 11,500. However, the current relationship between US Dollar and Bitcoin points to a bounce to 51,030. Which is right? If traders believe that DXY will continue to act as a leading indicator for Bitcoin, they should expect Bitcoin to bounce. If traders feel the flag pattern is a more reliable formation, BTC will move lower. Perhaps BTC won’t reach either level. However, if Bullard and Kaplan continue to be hawkish, while Williams and Powell continue to be bearish, there is sure to be good 2-way action in the coming months in both BTC and the US Dollar!
Learn more about forex trading opportunities.
China has been on a rampage trying to crackdown on cryptocurrencies, threatening banks and miners throughout the country. Over this past weekend, China ordered domestic banks and payment platforms to stop provides services linked to trading of virtual currencies. As a result, Bitcoin has been selling off on fears that future of currency may not be Bitcoin, but rather simply digital fiat currencies. However, China isn’t the only one spreading fear into crypto HODLers. An Elon Musk tweet can send Bitcoin in either direction, depending on how he feels that day. The US government retrieved ransom Bitcoin, which until this point, was thought to be untraceable. In addition, more and more government officials in the US and around the world are calling for regulation of cryptos (governments always way their piece of your money!).
So, Bitcoin is moving lower. In February, Bitcoin began forming a rounding top formation and reached its all-time high on April 14th at 64895.22, which happened to be the same day as the Coinbase IPO (coincidence?). On May 10th, the cryptocurrency started to sell off aggressively and stalled near 30,000. Bitcoin consolidated in a flag pattern from May 10th to June 22nd between 30,066 and 41,341. On June 19th, the 50 Day Moving Average crossed below the 200 Day Moving Average forming a “Death Cross”, which as the name may imply, is a bearish signal. Today, price broke below the 30,066 lows and the bottom of the flag. The target of a flag pattern is the length of the flag poll added to the breakdown point from the flag, which in this case targets near 11,500.
Source: Tradingview, FOREX.com
If we overlay a chart of DXY (blue line) on a chart of Bitcoin, it appears that the US Dollar Index has been leading BTC since February. Price in DXY formed 3 higher highs ahead of Bitcoin. The US Dollar then began moving lower on March 30th, ahead of the Bitcoin selloff which began in April 14th. DXY bottomed on May 25th and began moving higher, with a breakout on June 16th (FOMC). The US Dollar Index traced to the 61.8% Fibonacci retracement level from the March 31st highs to the May 25th lows, near 92.00. If traders expect this relationship to continue, BTC may be in for an aggressive bounce soon. It’s difficult to determine where BTC may bounce to if it is following DXY, as we don’t yet know if today’s low is going to be the low to measure from. However, if we assume it is, the 61.8% Fibonacci retracement in Bitcoin from the April 14th highs to today’s lows is near 51,030!
Source: Tradingview, FOREX.com
Everything you wanted to know about DXY
BTC by itself points to a continued selloff to near 11,500. However, the current relationship between US Dollar and Bitcoin points to a bounce to 51,030. Which is right? If traders believe that DXY will continue to act as a leading indicator for Bitcoin, they should expect Bitcoin to bounce. If traders feel the flag pattern is a more reliable formation, BTC will move lower. Perhaps BTC won’t reach either level. However, if Bullard and Kaplan continue to be hawkish, while Williams and Powell continue to be bearish, there is sure to be good 2-way action in the coming months in both BTC and the US Dollar!
Learn more about forex trading opportunities.
Related tags:


The complete CFD trading experience
Award-winning platforms, competitive spreads, low commissions and dedicated support.
We live and breathe the markets and are dedicated to helping traders realise their ambitions as we continue to set the industry bar.
Economic calendar
Web Trader platform
Our sophisticated web-based platform is packed with features.
Related articles
Gold forecast: Rising yields become too hot for gold, but the outlook is far from bearish
Gold and silver prices took a plunge today, with the former down 3% and the latter falling some 5% by mid European session, before bouncing off their lows. The losses come after the metals remained largely supported until last week, despite the big dollar rally and surging bond yields as we have seen in recent weeks. But it simply got too much, and the metals succumbed to pressure today.

USD into a Massive Week as Yields Fly and Gold Breaks
It’s a huge week with PCE and NFP, but it’s what’s happening off of the calendar that demands attention with US yields flying to fresh multi-decade highs.


USDJPY Forecast Intervention Fears Clash with Dollar Strength
Recent trading sessions have produced mixed results for the Japanese yen. By the end of last week, USD/JPY had fallen by more than 1.00%, reflecting a modest recovery in the yen. However, the start of this week has seen the pair move slightly back in favor of the U.S. dollar, posting gains of around 0.04%.

StoneX Europe Ltd may make third party material available on this website which may contain information included but not limited to the conditions of financial markets. The material is for information purposes only and does not contain, and should not be construed as containing, investment advice and/or investment recommendation and/or an investment research and/or an offer of or solicitation for any transactions in financial instruments; any decision to enter into a specific transaction shall be made by the client following an assessment by him/her of their situation.
StoneX Europe Ltd makes no representation or warranty and assumes no liability as to the accuracy or completeness of the information provided, nor any loss arising from any investment based on a recommendation, forecast or other information supplied. You should always seek independent advice as to your suitability to speculate in any related markets and your ability to assume the associated risks, if you are at all unsure. We are not under any obligation to update any such material. Any opinion made may be personal to the author and may not reflect the opinion of StoneX Europe Ltd.