






Brexit Bill is Passed however Timetable is Rejected
The situation is going to become more fluid. Expect more volatility ahead.
Share this:

UK Parliament passed the Withdrawal Agreement Bill. However, they also refused to be handcuffed into Boris Johnson’s timetable of just 2 days to read and debate the matter. The UK’s main opposition party leader, Corbyn, said afterwards that Johnson needs to agree to a reasonable timetable. PM Johnson must now determine whether to accelerate plans to leave the EU with no deal or ask for an extension past the October 31st deadline. One option Johnson is considering is that the UK accept a 10-day extension, as long as it is the final extension from the EU.
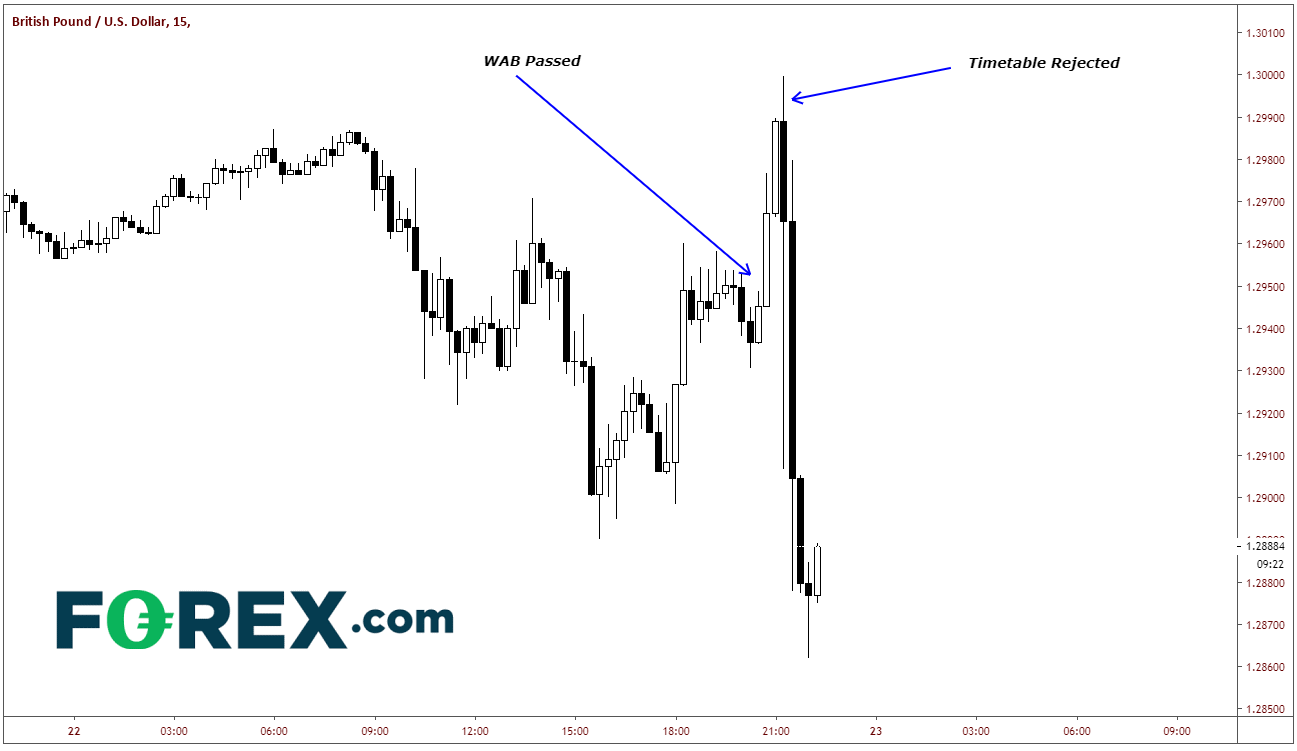
Upon passage of the WAB, GBP/USD bid up roughly 75 pips in hopes that the timetable would be passed. However, as soon as the timetable was rejected, the pair fell from roughly 1.3000 to 1.2832 on concerns that Brexit deal will be delayed further, or even worse, will end with no deal at all.
Source: Tradingview, City Index
On a daily timeframe, GBP/USD is currently consolidating just below the psychological level and horizontal level of 1.3000. Although has made attempts to close above 1.3000 over the last 4 days, it has yet to do so. The bottom of the consolidation zone is roughly between 1.2880, which is the 38.2% retracement level from the April 2018 highs to the September 3rd lows, and 1.2840, which is the 61.8% Fibonacci retracement level from the May 6th highs to the September 3rd lows. A break above or below these levels could quickly push the markets 200 pips in either direction.
Source: Tradingview, City Index
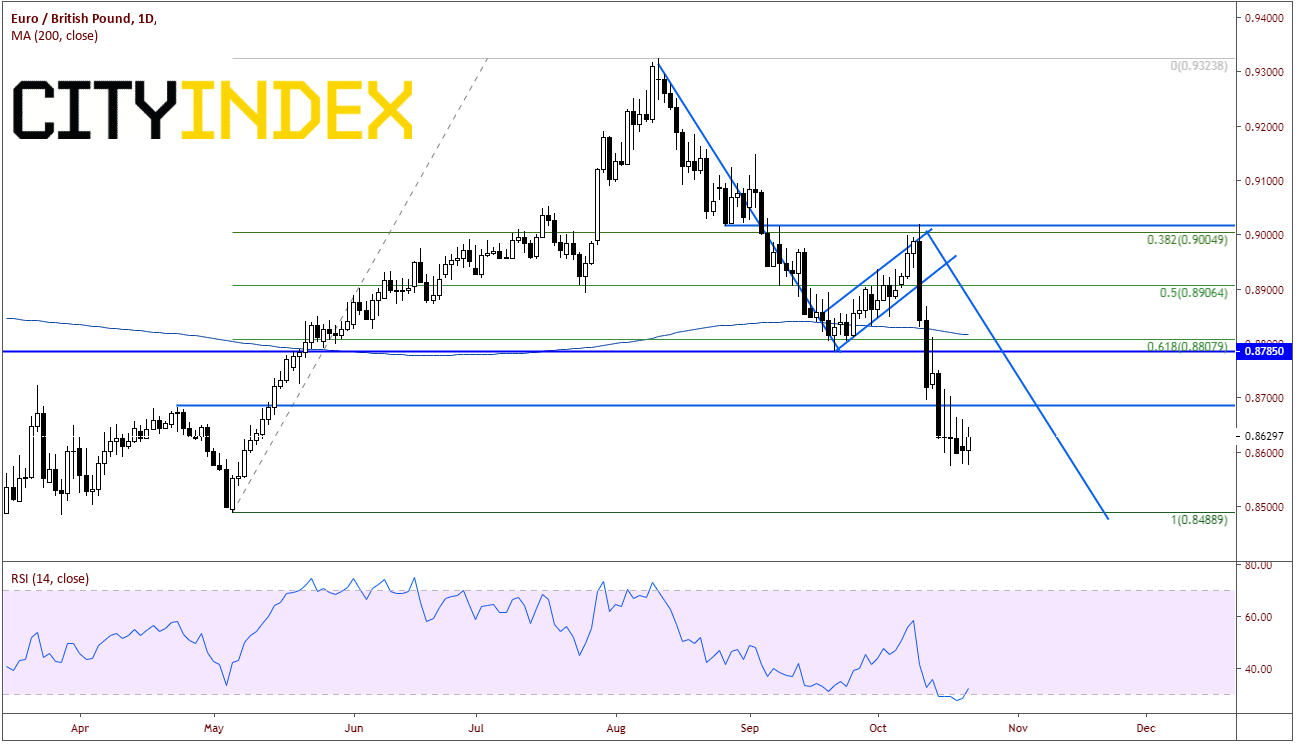
On a daily timeframe, it appears EUR/GBP still has room to go on the downside towards .8500 to complete the flag formation. However, the RSI is oversold, and with the news today it’s no surprise the pair bounced to give time to the RSI to unwind back into neutral territory before it resumes it descent lower. Horizontal resistance comes in near .8700.
Source: Tradingview, City Index
As we get closer and closer to the October 31st “drop dead” date for a Brexit deal, the situation is going to become more and more fluid. Expect even more volatility as time passes!
UK Parliament passed the Withdrawal Agreement Bill. However, they also refused to be handcuffed into Boris Johnson’s timetable of just 2 days to read and debate the matter. The UK’s main opposition party leader, Corbyn, said afterwards that Johnson needs to agree to a reasonable timetable. PM Johnson must now determine whether to accelerate plans to leave the EU with no deal or ask for an extension past the October 31st deadline. One option Johnson is considering is that the UK accept a 10-day extension, as long as it is the final extension from the EU.
Upon passage of the WAB, GBP/USD bid up roughly 75 pips in hopes that the timetable would be passed. However, as soon as the timetable was rejected, the pair fell from roughly 1.3000 to 1.2832 on concerns that Brexit deal will be delayed further, or even worse, will end with no deal at all.
Source: Tradingview, Forex.com
On a daily timeframe, GBP/USD is currently consolidating just below the psychological level and horizontal level of 1.3000. Although has made attempts to close above 1.3000 over the last 4 days, it has yet to do so. The bottom of the consolidation zone is roughly between 1.2880, which is the 38.2% retracement level from the April 2018 highs to the September 3rd lows, and 1.2840, which is the 61.8% Fibonacci retracement level from the May 6th highs to the September 3rd lows. A break above or below these levels could quickly push the markets 200 pips in either direction.
Source: Tradingview, Forex.com
On a daily timeframe, it appears EUR/GBP still has room to go on the downside towards .8500 to complete the flag formation. However, the RSI is oversold, and with the news today it’s no surprise the pair bounced to give time to the RSI to unwind back into neutral territory before it resumes it descent lower. Horizontal resistance comes in near .8700.
Source: Tradingview, Forex.com
As we get closer and closer to the October 31st “drop dead” date for a Brexit deal, the situation is going to become more and more fluid. Expect even more volatility as time passes!

The complete CFD trading experience
Award-winning platforms, competitive spreads, low commissions and dedicated support.
We live and breathe the markets and are dedicated to helping traders realise their ambitions as we continue to set the industry bar.
Economic calendar
Web Trader platform
Our sophisticated web-based platform is packed with features.
Related articles

USD/MXN Forecast: Peso Loses Momentum Ahead of Banxico Decision
Over recent trading sessions, the Mexican peso has started to show signs of losing strength against the U.S. dollar. This can be seen in the performance of USD/MXN, which has gained more than 1.7% over the last three sessions, highlighting the dollar's renewed strength against the peso.


Euro Short-term Outlook: EUR/USD Selloff Nears Critical Yearly Support 9 23 2026
Euro has fallen seven of the past nine sessions, with stretched momentum raising the stakes as EUR/USD closes in on a major inflection zone.


GBP/USD forecast: US dollar surges as bonds implode
The US dollar continued to press higher deep into the European session, supported by the slump in the bond markets as yields broke out across the curve. Following the recent hawkish Fed rate hike, yield spreads between the US and the rest of the world has continually increased, and that motion continued today, helped in part by some forecast-beating US macro data and hawkish Fed commentary.

StoneX Europe Ltd may make third party material available on this website which may contain information included but not limited to the conditions of financial markets. The material is for information purposes only and does not contain, and should not be construed as containing, investment advice and/or investment recommendation and/or an investment research and/or an offer of or solicitation for any transactions in financial instruments; any decision to enter into a specific transaction shall be made by the client following an assessment by him/her of their situation.
StoneX Europe Ltd makes no representation or warranty and assumes no liability as to the accuracy or completeness of the information provided, nor any loss arising from any investment based on a recommendation, forecast or other information supplied. You should always seek independent advice as to your suitability to speculate in any related markets and your ability to assume the associated risks, if you are at all unsure. We are not under any obligation to update any such material. Any opinion made may be personal to the author and may not reflect the opinion of StoneX Europe Ltd.