




Canadian Dollar Forecast: USD/CAD Sells Off on Trump's Tariff Delay
The longer-term range remains in-effect in USD/CAD, but the big question now is whether sellers can show follow through after a sizable reaction to resistance on Monday.
Share this:

Canadian Dollar, USD/CAD Talking Points:
- USD/CAD has sold off aggressively today after a visit to resistance at prior support on Monday at 1.4280-1.4300.
- The 90-day delay in tariff implementation along with a reduction to 10% tariffs for Canada has played a role, and at this stage the longer-term range remains in-play for USD/CAD. The 1.4000 level is the next big waypoint and that’s currently confluent with the 200-day moving average.
USD/CAD is showing a sizable move on the daily as the tariff tantrum in the U.S. has moved to a new stage, with a reduction in tariffs on Canada as President Trump has announced a 90-day pause in implementation on any country that isn’t China.
From a structural perspective, there was a resistance test at a prior support level earlier this week, and despite a higher-low yesterday at 1.4151, sellers held a lower-high into this morning and the pair was aggressively sold on news of the tariff delay. This can be a challenging spot to chase prices-lower, but that 1.4151 level now becomes short-term resistance potential and the next support level down is a major one at the 1.4000 handle, which is now confluent with the 200-day moving average in the pair.
USD/CAD Four-Hour Price Chart
 Chart prepared by James Stanley; data derived from Tradingview
USD/CAD Strategy
On a bigger picture basis this sets the stage for continuation of the nine-year range in the pair. I looked into this in the webinar yesterday and countless times over the past few months as the tariff saga has raged in the background, and as I shared throughout I expected this long-term mean reversion backdrop to continue. Timing, however, could remain as a challenge and even as of yesterday, we couldn’t yet rule out another push from bulls up to the 1.4402 or even 1.4500 areas.
But now that there’s been a bit of softening in the tariff threat, with Trump instead focusing the aim on China would lead to a prolonged scenario, USD/CAD is threatening larger breakdown of the short-term backdrop which brings back into play the range that’s been in-play since 2016.
The attraction here is that if we do get continuation in the longer-term range, there could be significant downside left to be seen, with USD/CAD pushing down towards 1.3000 or perhaps even towards 1.2500 or 1.2000 on a longer-term basis, both prices that were last in-play in 2021 and 2022.
USD/CAD Monthly Chart
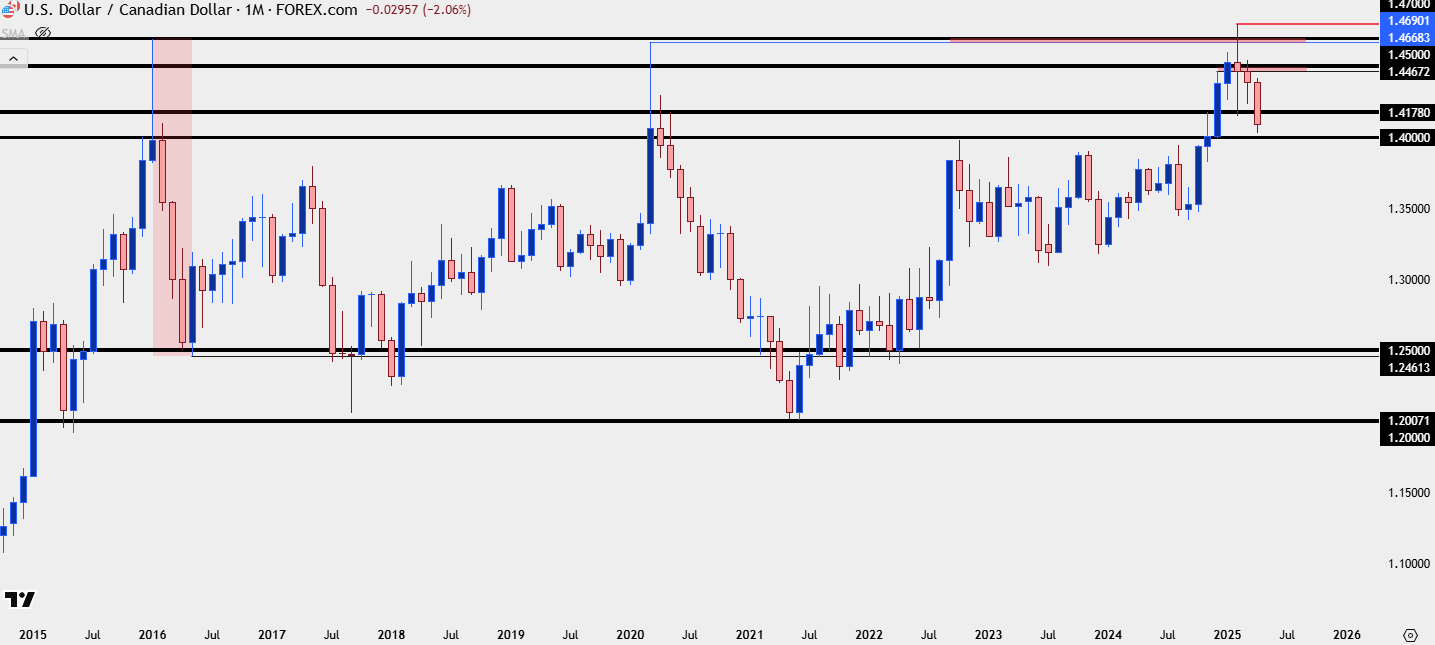 Chart prepared by James Stanley; data derived from Tradingview
USD/CAD Shorter-Term Strategy
As I’ve been saying on the long-term range in USD/CAD, the market would likely need some cessation of tariff fears before the bigger picture pullback could star to play out. And that is not quite here yet, although given President Trump’s prior focus on China in his first administration and more recently, U.S. Treasury Secretary Scott Bessent’s comment that this was Trump’s strategy all along has given the market a bit of hope that, perhaps, tariff fears will begin to dissipate from here.
That’s still very early, however, and as of now a 10% baseline tariff is set to remain to go along with this 90-day delay.
For USD/CAD, the pair is currently holding the 1.4100 level as support, and there’s lower-high resistance potential at both 1.4151 and 1.4240.
That 1.4000 level is big, so if we do see that come into play, I’d look for a short-term bounce up to 1.4100 in effort of tracking bearish continuation. If there is a fast break below 1.4000, then that becomes the spot for resistance potential on pullback plays.
USD/CAD Daily Price Chart
 Chart prepared by James Stanley; data derived from Tradingview
--- written by James Stanley, Senior Strategist
Canadian Dollar, USD/CAD Talking Points:
- USD/CAD has sold off aggressively today after a visit to resistance at prior support on Monday at 1.4280-1.4300.
- The 90-day delay in tariff implementation along with a reduction to 10% tariffs for Canada has played a role, and at this stage the longer-term range remains in-play for USD/CAD. The 1.4000 level is the next big waypoint and that’s currently confluent with the 200-day moving average.
USD/CAD is showing a sizable move on the daily as the tariff tantrum in the U.S. has moved to a new stage, with a reduction in tariffs on Canada as President Trump has announced a 90-day pause in implementation on any country that isn’t China.
From a structural perspective, there was a resistance test at a prior support level earlier this week, and despite a higher-low yesterday at 1.4151, sellers held a lower-high into this morning and the pair was aggressively sold on news of the tariff delay. This can be a challenging spot to chase prices-lower, but that 1.4151 level now becomes short-term resistance potential and the next support level down is a major one at the 1.4000 handle, which is now confluent with the 200-day moving average in the pair.
USD/CAD Four-Hour Price Chart
Chart prepared by James Stanley; data derived from Tradingview
USD/CAD Strategy
On a bigger picture basis this sets the stage for continuation of the nine-year range in the pair. I looked into this in the webinar yesterday and countless times over the past few months as the tariff saga has raged in the background, and as I shared throughout I expected this long-term mean reversion backdrop to continue. Timing, however, could remain as a challenge and even as of yesterday, we couldn’t yet rule out another push from bulls up to the 1.4402 or even 1.4500 areas.
But now that there’s been a bit of softening in the tariff threat, with Trump instead focusing the aim on China would lead to a prolonged scenario, USD/CAD is threatening larger breakdown of the short-term backdrop which brings back into play the range that’s been in-play since 2016.
The attraction here is that if we do get continuation in the longer-term range, there could be significant downside left to be seen, with USD/CAD pushing down towards 1.3000 or perhaps even towards 1.2500 or 1.2000 on a longer-term basis, both prices that were last in-play in 2021 and 2022.
USD/CAD Monthly Chart
Chart prepared by James Stanley; data derived from Tradingview
USD/CAD Shorter-Term Strategy
As I’ve been saying on the long-term range in USD/CAD, the market would likely need some cessation of tariff fears before the bigger picture pullback could star to play out. And that is not quite here yet, although given President Trump’s prior focus on China in his first administration and more recently, U.S. Treasury Secretary Scott Bessent’s comment that this was Trump’s strategy all along has given the market a bit of hope that, perhaps, tariff fears will begin to dissipate from here.
That’s still very early, however, and as of now a 10% baseline tariff is set to remain to go along with this 90-day delay.
For USD/CAD, the pair is currently holding the 1.4100 level as support, and there’s lower-high resistance potential at both 1.4151 and 1.4240.
That 1.4000 level is big, so if we do see that come into play, I’d look for a short-term bounce up to 1.4100 in effort of tracking bearish continuation. If there is a fast break below 1.4000, then that becomes the spot for resistance potential on pullback plays.
USD/CAD Daily Price Chart
Chart prepared by James Stanley; data derived from Tradingview
--- written by James Stanley, Senior Strategist
Latest market news




The complete CFD trading experience
Award-winning platforms, competitive spreads, low commissions and dedicated support.
We live and breathe the markets and are dedicated to helping traders realise their ambitions as we continue to set the industry bar.
Economic calendar
Web Trader platform
Our sophisticated web-based platform is packed with features.
Related articles
Gold Price Outlook: XAU/USD Resistance at $4200 Sets Up for NFP
It was a strong sell-off to start the week in gold and despite a Tuesday bounce, sellers are continuing to push following a resistance hit at the $4200 level.
Canadian Dollar Forecast: USD/CAD Four-Week Rally Eyes Yearly Highs 9 30 2026
USD/CAD has advanced in 14 of the past 15 sessions, but stretched momentum raises the stakes as major resistance and NFP come into focus.

Nasdaq Breakout Potential into Q4 for Melt Up Scenarios
The headlines seem negative in almost any place that you look, with surging Treasury yields and frothy AI valuations getting more and more attention. But, if it’s so bad, why hasn’t the Nasdaq melted down yet, even as the Fed has started hiking rates?
StoneX Europe Ltd may make third party material available on this website which may contain information included but not limited to the conditions of financial markets. The material is for information purposes only and does not contain, and should not be construed as containing, investment advice and/or investment recommendation and/or an investment research and/or an offer of or solicitation for any transactions in financial instruments; any decision to enter into a specific transaction shall be made by the client following an assessment by him/her of their situation.
StoneX Europe Ltd makes no representation or warranty and assumes no liability as to the accuracy or completeness of the information provided, nor any loss arising from any investment based on a recommendation, forecast or other information supplied. You should always seek independent advice as to your suitability to speculate in any related markets and your ability to assume the associated risks, if you are at all unsure. We are not under any obligation to update any such material. Any opinion made may be personal to the author and may not reflect the opinion of StoneX Europe Ltd.