





Did Palladium Fly Too Close To The Sun
Now the world’s most valuable precious metal, Palladium prices have continued to soar this year after surpassing gold’s value in March. Yet its bump at the highs suggests a much-needed correction is underway.
Share this:

Now the world’s most valuable precious metal, Palladium prices have continued to soar this year after surpassing gold’s value in March. Yet its bump at the highs suggests a much-needed correction is underway.
High demand and low supply palladium has been a key driver for spot prices, since about 85% of its supply is used in exhaust systems in cars to help turn toxic pollutants into water vapour and carbon dioxide. Since 2016 it has nearly tripled in price, although the 40% rally from the October low goes to show how parabolic its trend has been of late.
Gains from trough to peak:
- April 2003: +1,140.3%
- January 2016: +298.5%
- August 2018: +120.7%
- October 2019: +43.2%
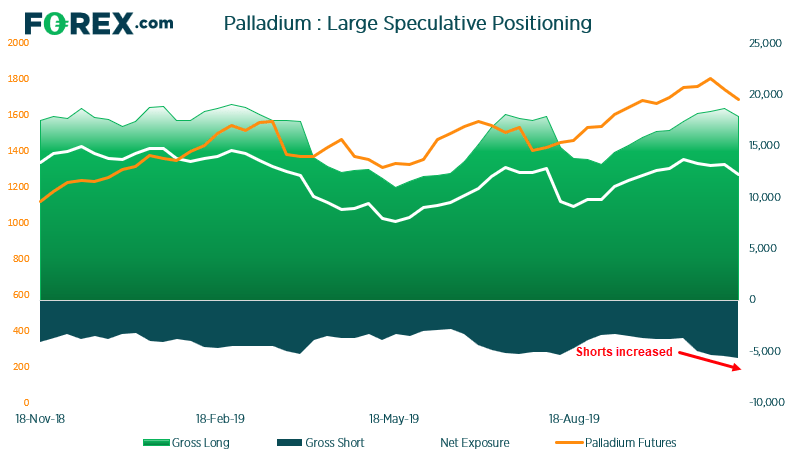
Whilst we cannot claim to have predicted the top, it wasn’t without warning either. We can see that gross short exposure had been creeping up into the price highs and has dragged net-long exposure to a 6-week low, ahead of last week’s top. Gross-long exposure had also peaked around levels that have been associated with corrections since mid-2018, so whilst positioning is not flagging a sentiment extreme, it could point towards a deeper retracement for the metal.
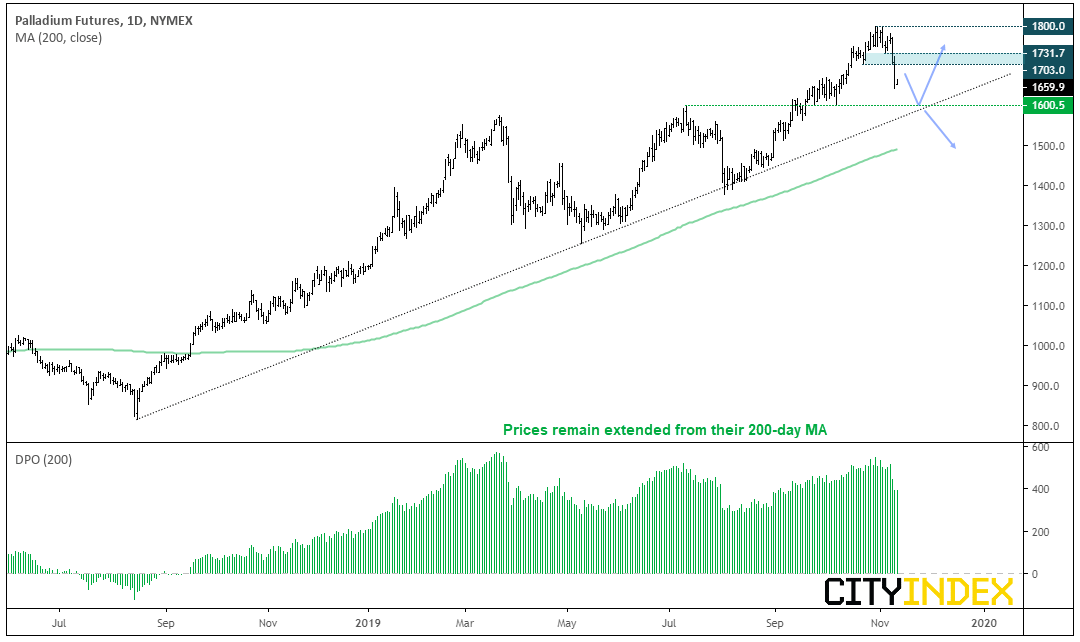
Technically, palladium appears poised for a re-test of its bullish trendline. Since peaking just beneath 1,800, a lower high formed before breaking a prior low and warning of a change in trend. Given it has fallen over 7% in the last two sessions, bearish momentum is clearly picking up and further losses appear more likely. Yet despite these losses, price action remains overextended relative to its 200-day MA.
Moreover, if we’re to see similar levels of volatility today that we have over the past two, it could retest 1,600 later today.
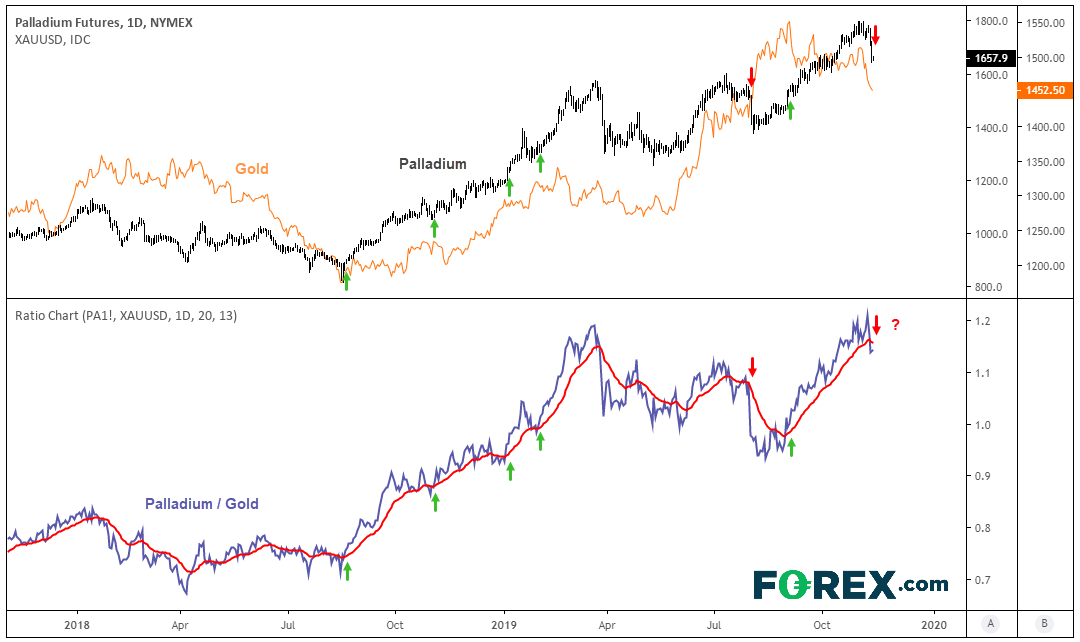
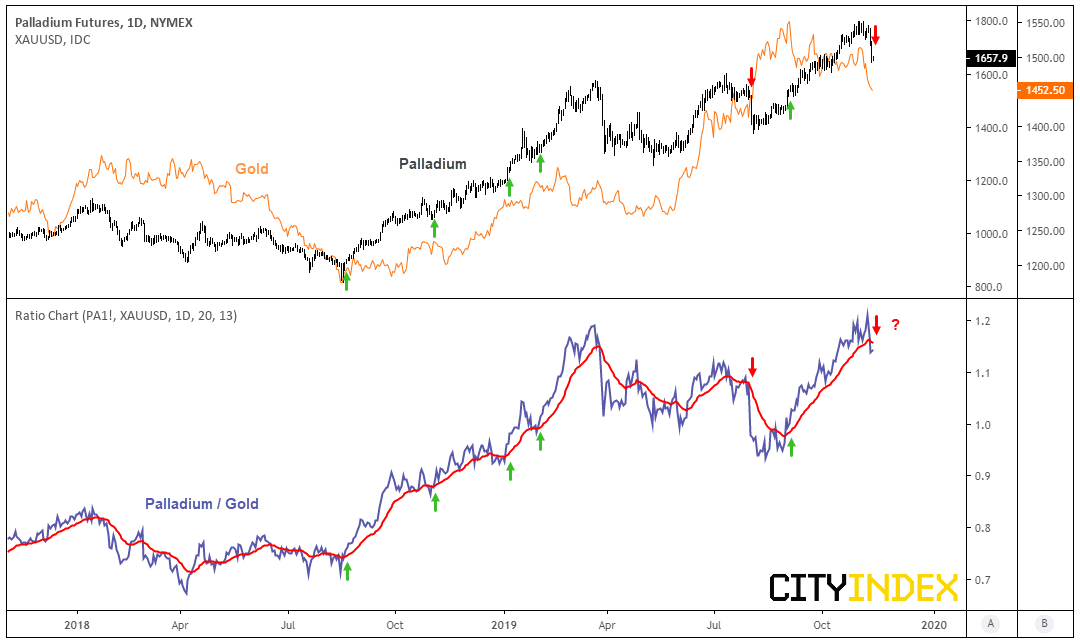
Taking this a step further, the palladium/gold ratio suggests there could be further downside for palladium. Whilst the relationship is not perfect, we can see the ratio crossing above/below its 20-day MA has picked some decent turning points on spot palladium. We’ve outlined a bearish scenario on gold yet palladium still remains relatively high and possibly over stretched from its long-term average. Therefor we’ll continue to monitor to see if the ratio remains beneath its 20-day MA, as it could suggest palladium may consider breaking its long-term bullish trendline.
Related analysis:
Gold’s Worst Week in 3 Years Sees Bears Firmly Back In Control
Gold drops to key support
Now the world’s most valuable precious metal, Palladium prices have continued to soar this year after surpassing gold’s value in March. Yet its bump at the highs suggests a much-needed correction is underway.
High demand and low supply palladium has been a key driver for spot prices, since about 85% of its supply is used in exhaust systems in cars to help turn toxic pollutants into water vapour and carbon dioxide. Since 2016 it has nearly tripled in price, although the 40% rally from the October low goes to show how parabolic its trend has been of late.
Gains from trough to peak:
- April 2003: +1,140.3%
- January 2016: +298.5%
- August 2018: +120.7%
- October 2019: +43.2%
Whilst we cannot claim to have predicted the top, it wasn’t without warning either. We can see that gross short exposure had been creeping up into the price highs and has dragged net-long exposure to a 6-week low, ahead of last week’s top. Gross-long exposure had also peaked around levels that have been associated with corrections since mid-2018, so whilst positioning is not flagging a sentiment extreme, it could point towards a deeper retracement for the metal.
Technically, palladium appears poised for a re-test of its bullish trendline. Since peaking just beneath 1,800, a lower high formed before breaking a prior low and warning of a change in trend. Given it has fallen over 7% in the last two sessions, bearish momentum is clearly picking up and further losses appear more likely. Yet despite these losses, price action remains overextended relative to its 200-day MA.
Moreover, if we’re to see similar levels of volatility today that we have over the past two, it could retest 1,600 later today.
Taking this a step further, the palladium/gold ratio suggests there could be further downside for palladium. Whilst the relationship is not perfect, we can see the ratio crossing above/below its 20-day MA has picked some decent turning points on spot palladium. We’ve outlined a bearish scenario on gold yet palladium still remains relatively high and possibly over stretched from its long-term average. Therefor we’ll continue to monitor to see if the ratio remains beneath its 20-day MA, as it could suggest palladium may consider breaking its long-term bullish trendline.
Related analysis:
Gold’s Worst Week in 3 Years Sees Bears Firmly Back In Control
Gold drops to key support
Related tags:
Latest market news



The complete CFD trading experience
Award-winning platforms, competitive spreads, low commissions and dedicated support.
We live and breathe the markets and are dedicated to helping traders realise their ambitions as we continue to set the industry bar.
Economic calendar
Web Trader platform
Our sophisticated web-based platform is packed with features.
Related articles
StoneX Europe Ltd may make third party material available on this website which may contain information included but not limited to the conditions of financial markets. The material is for information purposes only and does not contain, and should not be construed as containing, investment advice and/or investment recommendation and/or an investment research and/or an offer of or solicitation for any transactions in financial instruments; any decision to enter into a specific transaction shall be made by the client following an assessment by him/her of their situation.
StoneX Europe Ltd makes no representation or warranty and assumes no liability as to the accuracy or completeness of the information provided, nor any loss arising from any investment based on a recommendation, forecast or other information supplied. You should always seek independent advice as to your suitability to speculate in any related markets and your ability to assume the associated risks, if you are at all unsure. We are not under any obligation to update any such material. Any opinion made may be personal to the author and may not reflect the opinion of StoneX Europe Ltd.