


Dow Jones Analysis: The DJIA Records Its Worst Drop in Months
The Dow Jones is not going through its best moment and, during today’s session, is already down more than -2.4% in the short term, marking a significant bearish bias not seen in several months. The strong selling pressure is mainly driven by a consistent decline in market confidence stemming from the conflict in the Middle East.
Share this:

The Dow Jones is not going through its best moment and, during today’s session, is already down more than -2.4% in the short term, marking a significant bearish bias not seen in several months.
The strong selling pressure is mainly driven by a consistent decline in market confidence stemming from the conflict in the Middle East. This scenario is shifting interest toward safe-haven markets such as bonds, which in turn reduces the appeal of risk assets like equity indices. As long as uncertainty persists, downside pressure on the Dow Jones is likely to continue gaining relevance in the coming sessions.


Uncertainty Takes Over the Market
The escalation of military tensions in the Middle East remains a key factor. Iranian drone attacks have been reported even in the United Arab Emirates and against international bases. The offensive remains active and, according to preliminary estimates, could last several weeks.
Iran has also declared the closure of the Strait of Hormuz, threatening to attack any vessel attempting to cross it, potentially disrupting the transit of approximately 20% of global oil and natural gas supply.
In response, the United Nations has called emergency meetings urging immediate de-escalation. However, no concrete progress has been reported that would suggest short-term stabilization.
This environment is already being reflected in confidence indicators. The CNN Fear and Greed Index remains in the low 30-point range, approaching “extreme fear” territory, signaling a sustained deterioration in market confidence.
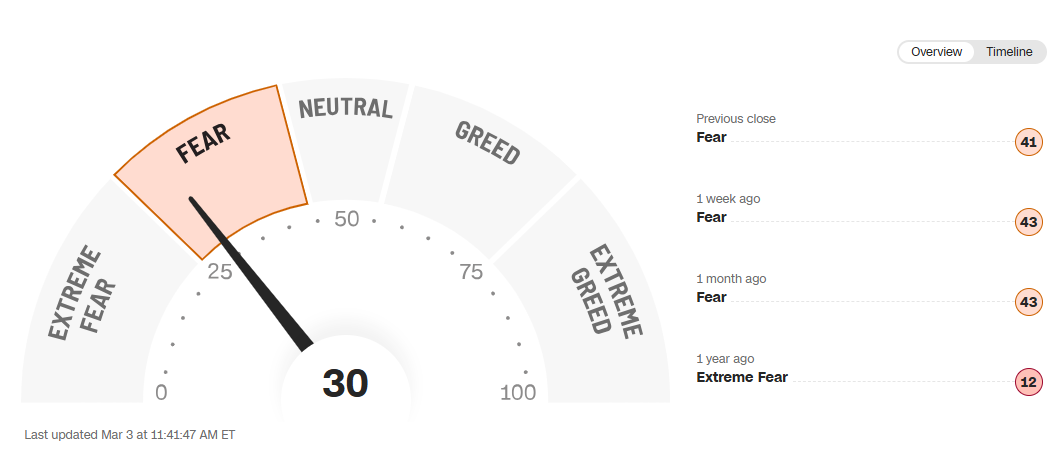
Source: CNN
When confidence weakens consistently, capital tends to rotate toward more stable assets. In this context, equity indices such as the Dow Jones, being risk assets, have begun to lose attractiveness.
Indeed, the index’s main components are already showing broad weakness: Goldman Sachs is down -1.31%, Caterpillar falls -3.86%, Amgen declines -2.64%, Home Depot drops -1.74%, while Microsoft is the only one attempting to remain stable at +0.46%. This confirms that weakness is spreading across the index’s major constituents and reflects a consistent lack of confidence in current equity market movements.
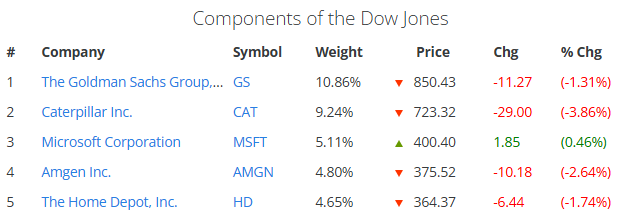
Source: Slickcharts
Recent weakness in risk markets has coincided with renewed interest in fixed income. The 10-year US Treasury yield has once again moved above 4.00%, recovering from the declines seen in previous sessions.
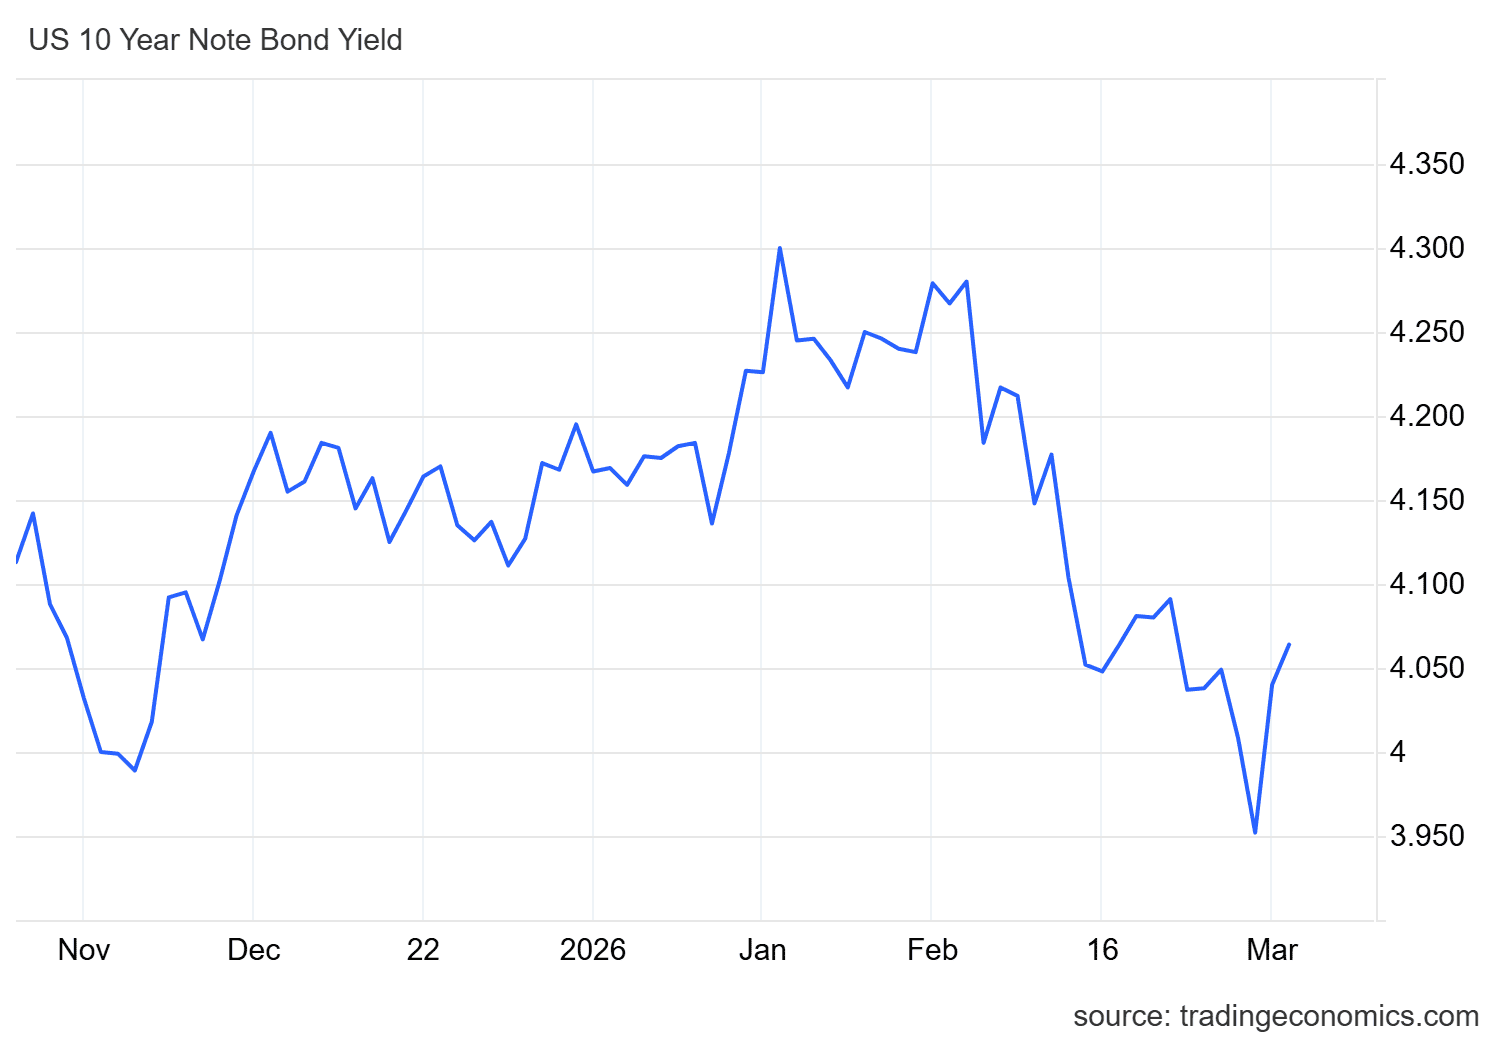
Source: TradingEconomics
The rebound in yields increases the relative attractiveness of bonds compared to equity indices, encouraging capital rotation toward more defensive assets. If geopolitical uncertainty persists, this dynamic could continue pressuring demand for the Dow Jones and maintain a bearish short-term bias.
Technical Outlook for the Dow Jones
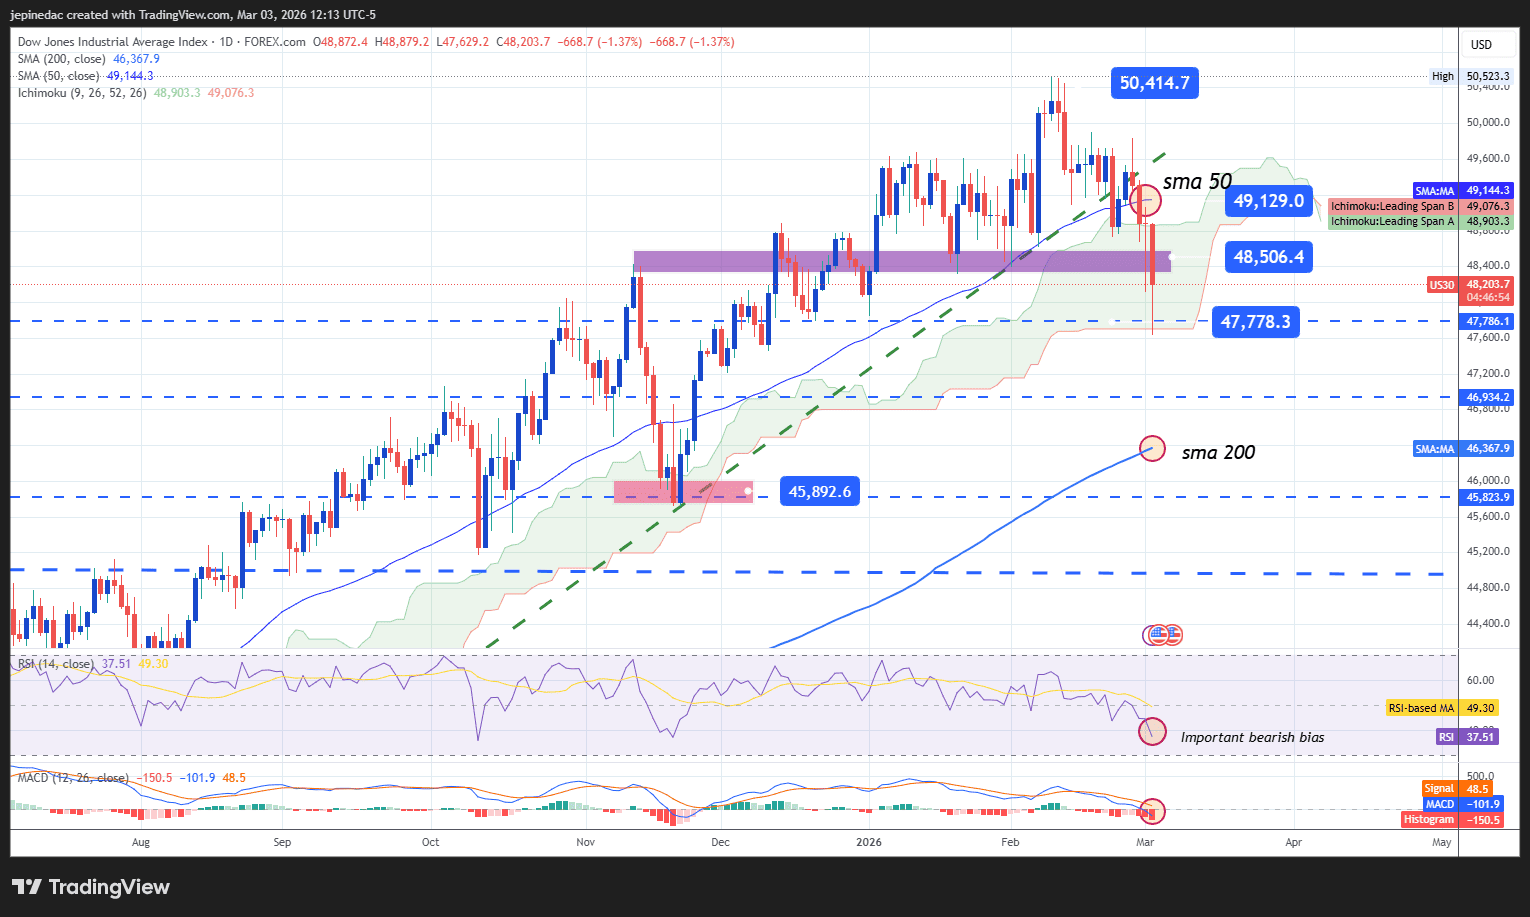
Source: StoneX, Tradingview
- Bearish Momentum Begins to Consolidate: In recent sessions, the break of the upward trendline that had held for several months has been confirmed. This marks a relevant structural shift in price dynamics. Although a fully developed downtrend has not yet been confirmed, the break of the prior bullish structure opens the door to a phase of greater weakness and short-term indecision. If selling pressure persists, a clearer downward structure could begin to form.
- RSI: The RSI remains below the neutral 50 level, indicating that average momentum over the past 14 sessions shows selling dominance. If the indicator continues to decline, it could reinforce the bearish bias in upcoming sessions.
- MACD: The MACD presents a similar scenario, with the histogram oscillating below the zero line. This reflects that short-term moving averages favor a bearish bias, supporting continued downside pressure.
Key Levels:
- 49,129 points – Relevant resistance: Level aligned with the 50-period simple moving average. Sustained moves above this area could reactivate a buying bias and restore relevance to the prior bullish structure.
- 48,506 points – Near-term barrier: A neutrality zone that has generated stability in recent weeks. If price fails to move decisively away from this level, a broader sideways range could consolidate.
- 47,778 points – Key support: Level corresponding to lows not seen since December 2025. A sustained break below this zone could trigger stronger downside momentum and open the door to a more consistent short-term downtrend.
Written by Julian Pineda, CFA, CMT – Market Analyst
Follow him on: @julianpineda25




The complete CFD trading experience
Award-winning platforms, competitive spreads, low commissions and dedicated support.
We live and breathe the markets and are dedicated to helping traders realise their ambitions as we continue to set the industry bar.
Economic calendar
Web Trader platform
Our sophisticated web-based platform is packed with features.
Related articles

Wall Street Forecast: DJIA rises on hawkish Fed expectations & rising yields
U.S. stocks are opening lower on Wednesday, pressured by higher crude oil prices and rising government bond yields, as investors await further developments from negotiations in the Middle East and ahead of a key U.S.-China summit.


Why Crude Oil Slid While Middle East Tensions Kept Building
The crude oil pullback from monthly highs is running ahead of the headlines, as WTI and Brent ease while Middle East tensions stay unresolved.


Crude and dollar rebound as Trump says deal possible after the election
Donald Trump’s speech at the UN seems to have poured cold waters on any hopes of a deal. Crude oil, the US dollar and bond yields all bounced back from their lows, causing fresh pressure on foreign currencies, European indices and to a lesser degree precious metals.

StoneX Europe Ltd may make third party material available on this website which may contain information included but not limited to the conditions of financial markets. The material is for information purposes only and does not contain, and should not be construed as containing, investment advice and/or investment recommendation and/or an investment research and/or an offer of or solicitation for any transactions in financial instruments; any decision to enter into a specific transaction shall be made by the client following an assessment by him/her of their situation.
StoneX Europe Ltd makes no representation or warranty and assumes no liability as to the accuracy or completeness of the information provided, nor any loss arising from any investment based on a recommendation, forecast or other information supplied. You should always seek independent advice as to your suitability to speculate in any related markets and your ability to assume the associated risks, if you are at all unsure. We are not under any obligation to update any such material. Any opinion made may be personal to the author and may not reflect the opinion of StoneX Europe Ltd.