





DXY may be Ready to Resume Move Higher
The DXY has been consolidating in a pennant formation since reaching the 161.8% Fibonacci extension
Share this:

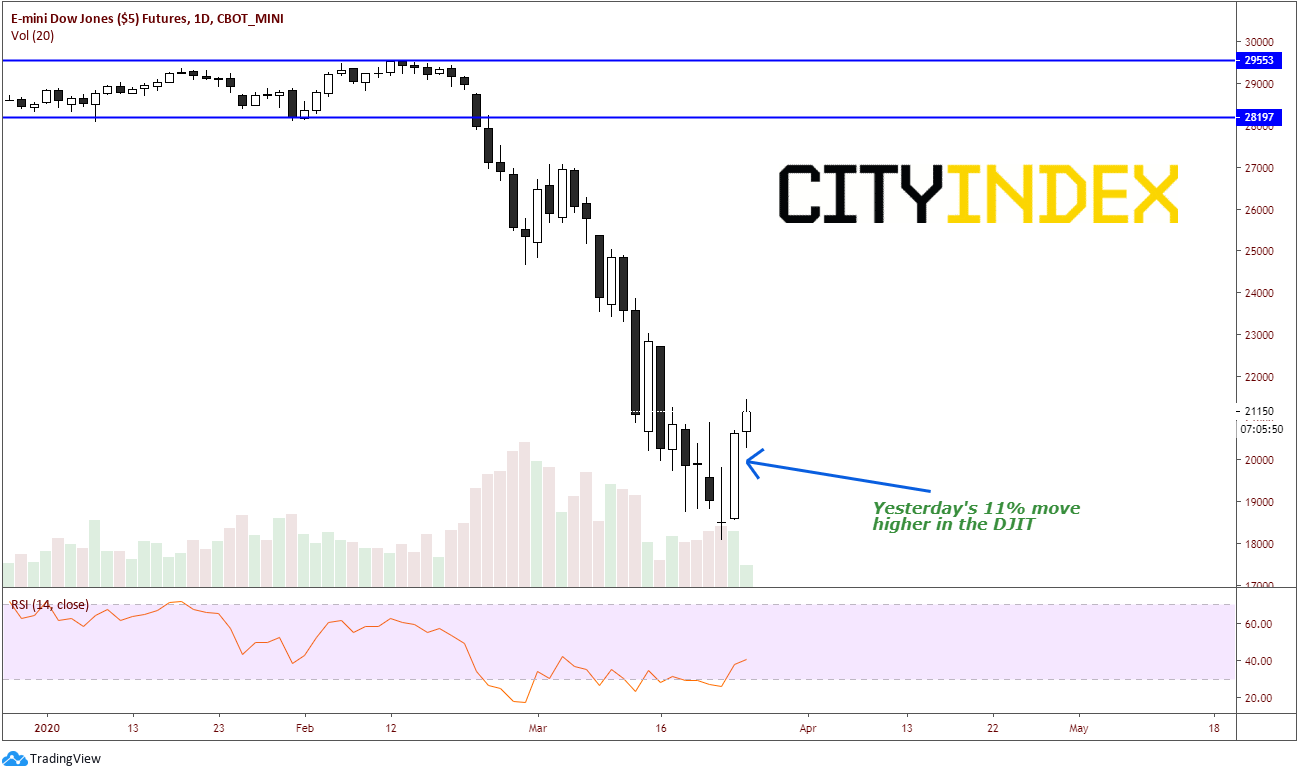
The US Senate and White House reach FINALLY reached a bi-partisan fiscal stimulus deal worth an estimated $2 trillion. The deal was reached at roughly 1:00am ET this morning, though traders have been expecting the agreement all day yesterday, as the DJIA rallied over 11% in its largest one day move since 1933.
Source: Tradingview, City Index
As global stock markets caught up to yesterdays closed in the US, the US Dollar began to pull back. However, on a 240-minute the DXY has already been consolidating in a pennant formation since reaching the 161.8% Fibonacci extension from the highs in mid-February to the lows on March 9th. The consolidation is near a trendline dating back to May 2018. If the DXY does break higher from here, the target is near 109.80.
Source: Tradingview, City Index
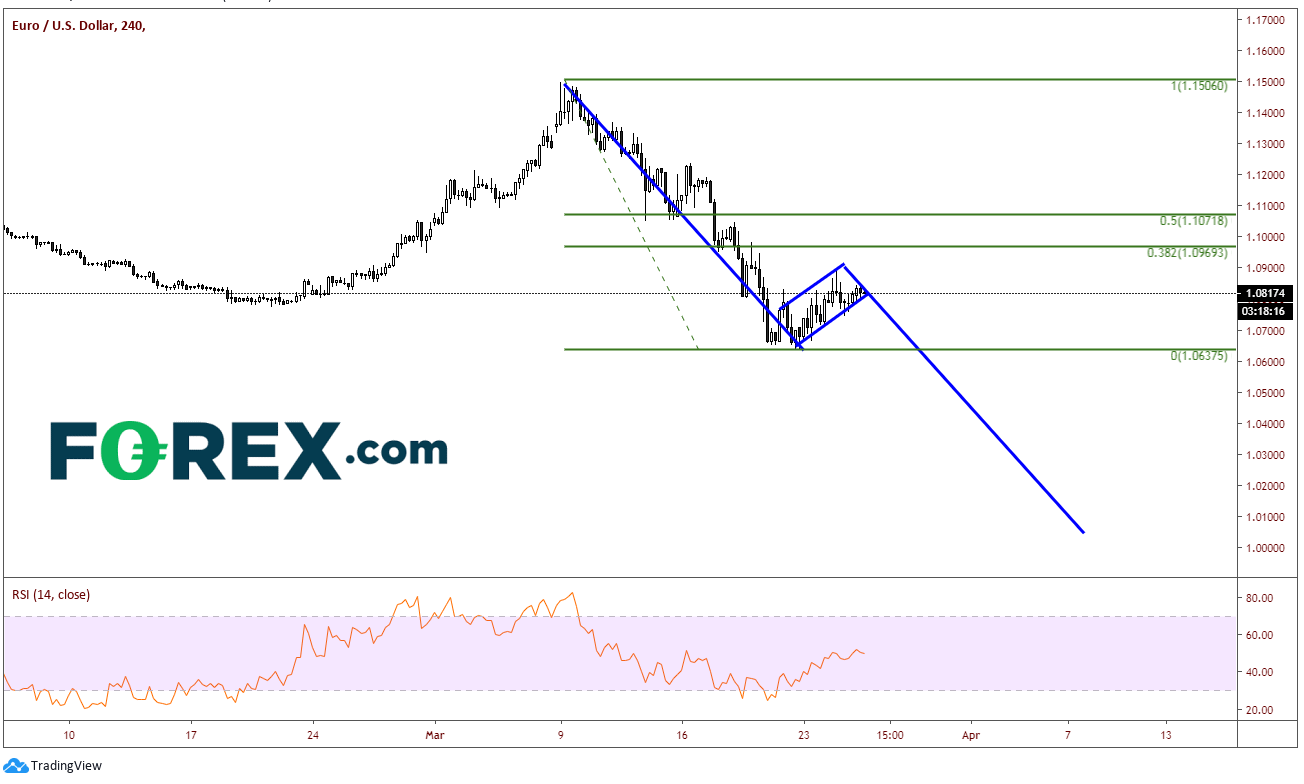
EUR/USD often trades the inverse to the DXY, as the Euro makes up almost 58% of the US Dollar Index. So, it would make sense to see a similar, opposite move in EUR/USD. On a 240-minute Price action in the EUR/USD has been moving lower since the highs on February 20th, stalled on March 20th, and began consolidating in a flag like formation. This too seems as its ready for its next move. If price does break lower out of the flag formation, the current target is near parity (1.0050). (EUR/USD can still move higher, as high as 1.1070 and still be in a valid flag formation, just note that from wherever price breaks lower from the flag, the flagpole needs to be adjusted to that breakdown point. )
Source: Tradingview, City Index
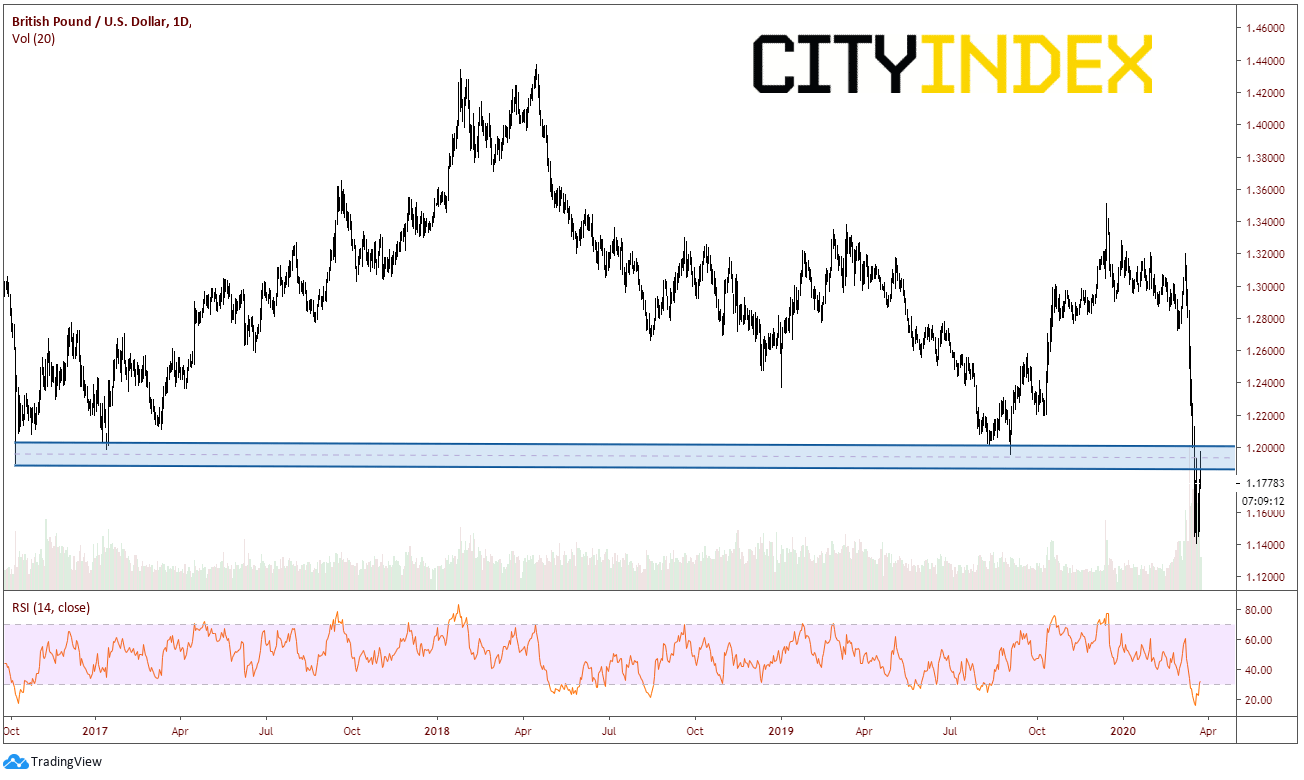
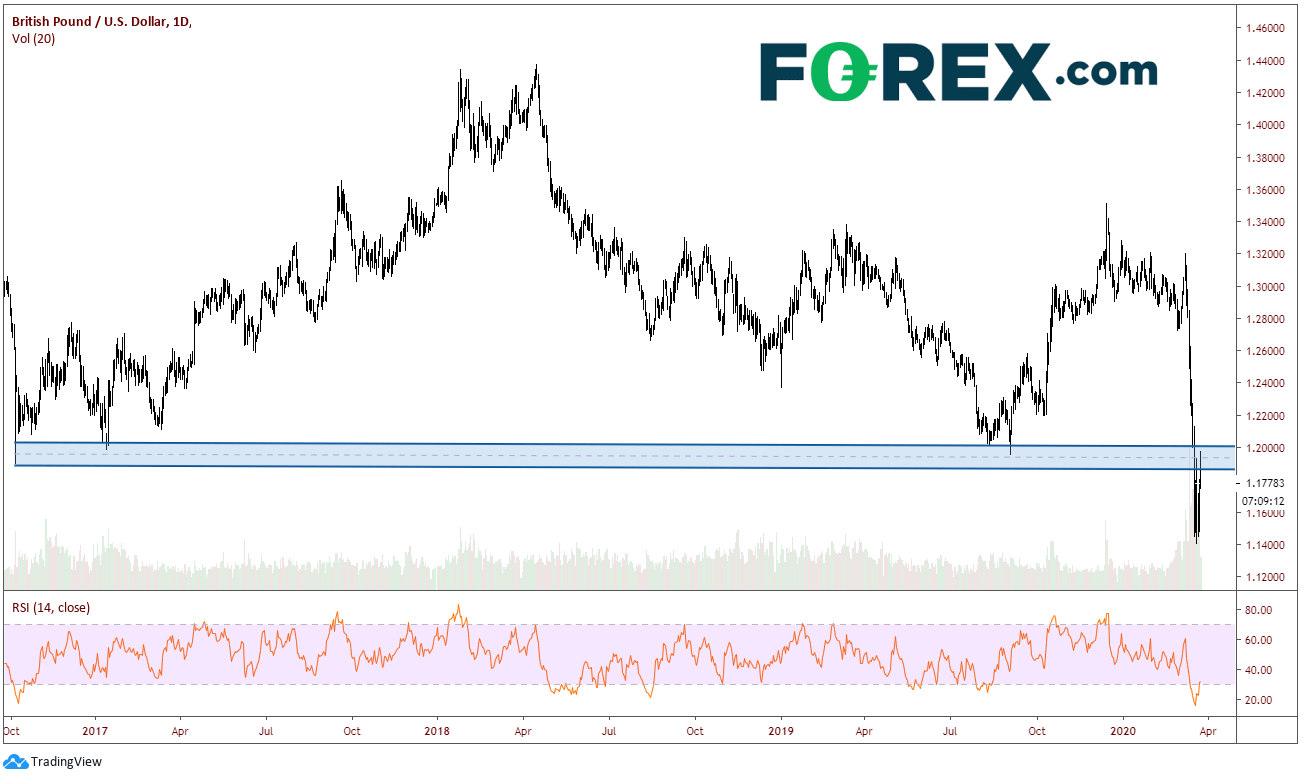
On a daily GBP/USD chart we can the US Dollar pair is trading in a resistance zone, just below 1.2000. If price holds below this key psychological resistance area and pulls back, it would provide more evidence that the DXY can move higher.
Source: Tradingview, City Index
The set-ups and resistance in these US Dollar pairs provide evidence that DXY may be headed higher. We have seen an extreme move off the lows on March 9th from 94.60 to roughly 103. It’s hard to imagine we could see a move like that again soon. But then again, the way these markets have been moving over the last month, it is possible!
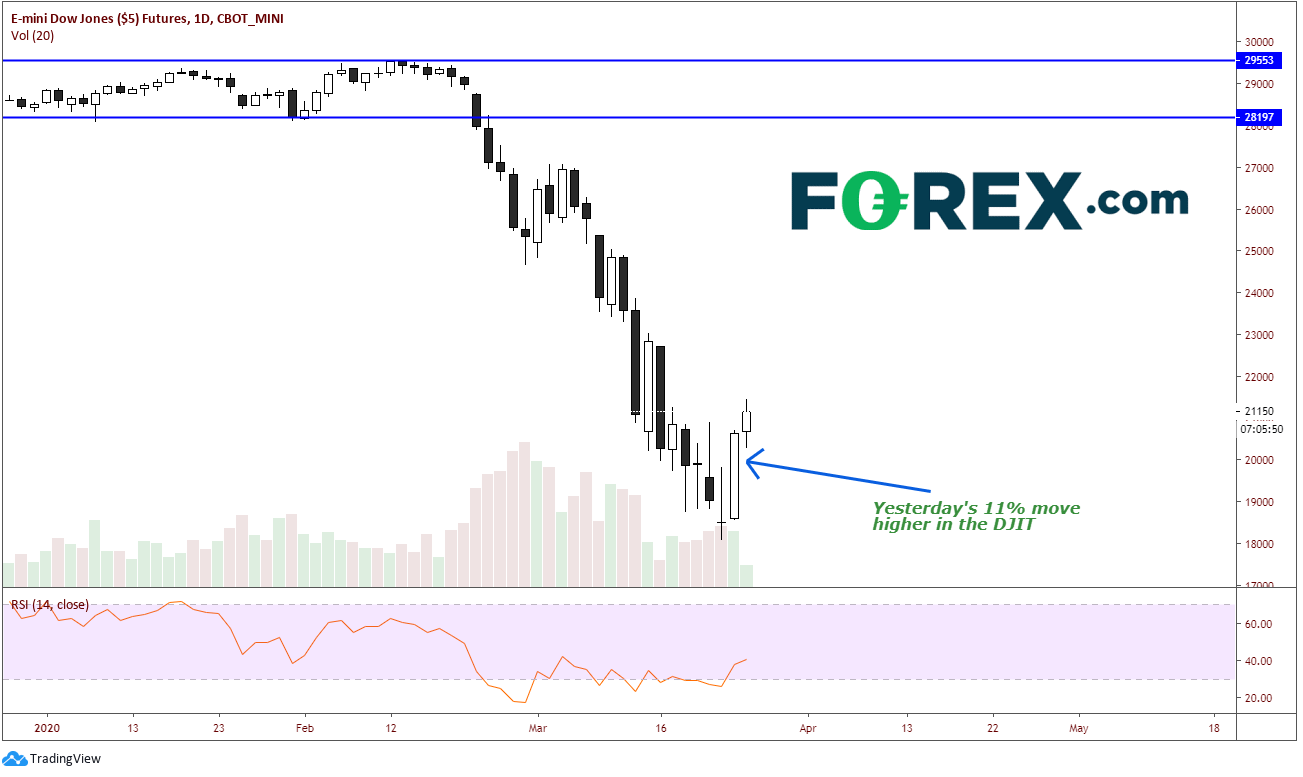
The US Senate and White House reach FINALLY reached a bi-partisan fiscal stimulus deal worth an estimated $2 trillion. The deal was reached at roughly 1:00am ET this morning, though traders have been expecting the agreement all day yesterday, as the DJIA rallied over 11% in its largest one day move since 1933.
Source: Tradingview, FOREX.com
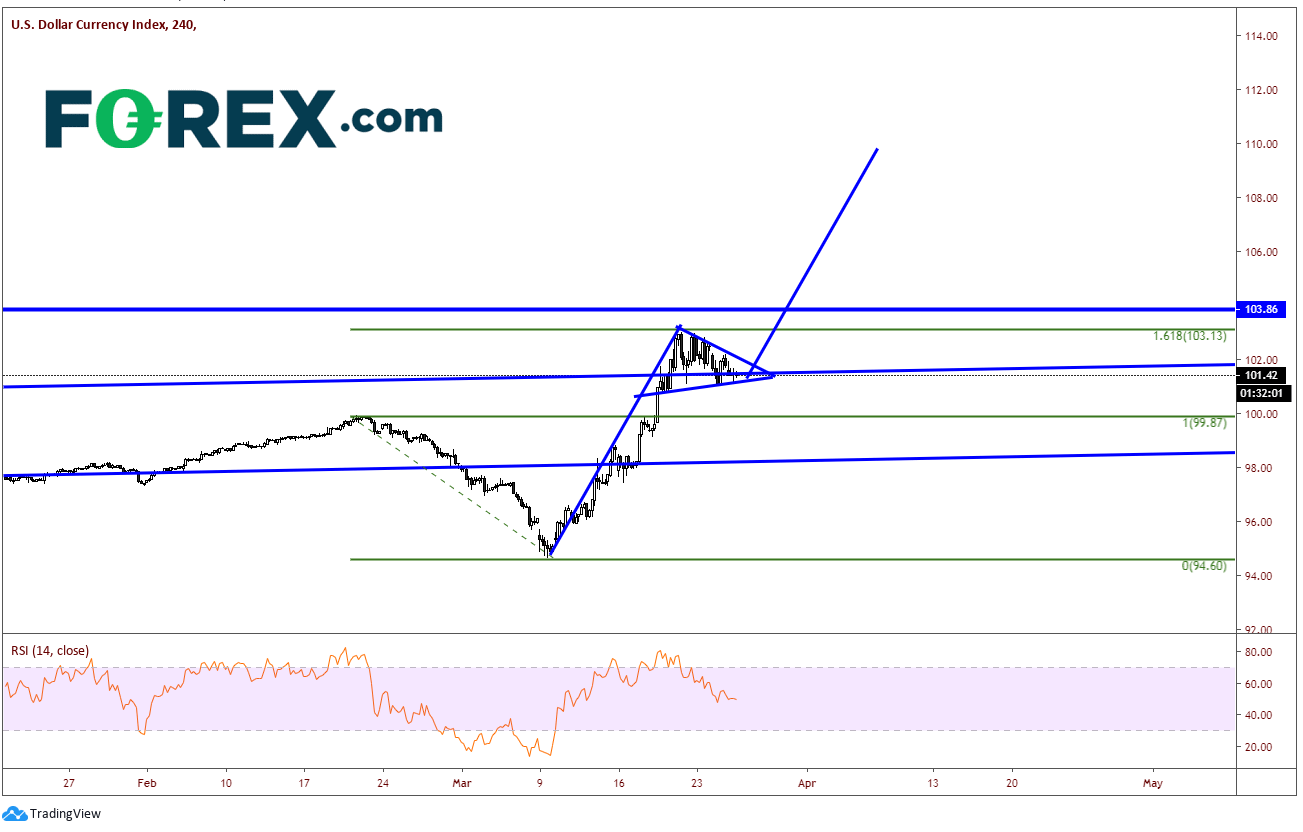
As global stock markets caught up to yesterdays closed in the US, the US Dollar began to pull back. However, on a 240-minute the DXY has already been consolidating in a pennant formation since reaching the 161.8% Fibonacci extension from the highs in mid-February to the lows on March 9th. The consolidation is near a trendline dating back to May 2018. If the DXY does break higher from here, the target is near 109.80.
Source: Tradingview, FOREX.com
EUR/USD often trades the inverse to the DXY, as the Euro makes up almost 58% of the US Dollar Index. So, it would make sense to see a similar, opposite move in EUR/USD. On a 240-minute Price action in the EUR/USD has been moving lower since the highs on February 20th, stalled on March 20th, and began consolidating in a flag like formation. This too seems as its ready for its next move. If price does break lower out of the flag formation, the current target is near parity (1.0050). (EUR/USD can still move higher, as high as 1.1070 and still be in a valid flag formation, just note that from wherever price breaks lower from the flag, the flagpole needs to be adjusted to that breakdown point. )
Source: Tradingview, FOREX.com
On a daily GBP/USD chart we can the US Dollar pair is trading in a resistance zone, just below 1.2000. If price holds below this key psychological resistance area and pulls back, it would provide more evidence that the DXY can move higher.
Source: Tradingview, FOREX.com
The set-ups and resistance in these US Dollar pairs provide evidence that DXY may be headed higher. We have seen an extreme move off the lows on March 9th from 94.60 to roughly 103. It’s hard to imagine we could see a move like that again soon. But then again, the way these markets have been moving over the last month, it is possible!




The complete CFD trading experience
Award-winning platforms, competitive spreads, low commissions and dedicated support.
We live and breathe the markets and are dedicated to helping traders realise their ambitions as we continue to set the industry bar.
Economic calendar
Web Trader platform
Our sophisticated web-based platform is packed with features.
Related articles

EUR/USD Update: Will Fed Expectations Keep Pressure on the Euro?
The week continues to present challenges for the euro's short-term strength. This is reflected in the recent performance of EUR/USD, which has declined by nearly 0.6% over the last three trading sessions


EUR/USD Forecast: Euro Extends Losses Ahead of Fed Rate Decision
The euro has started to face a more challenging period in the short term. The EUR/USD pair has already declined by nearly 0.81% over the last four trading sessions, a move that has begun to reinforce a meaningful bearish bias in favor of the U.S. dollar.
EUR/USD Analysis: Euro Attempts to Recover Following the ECB Decision
Today's session has been particularly relevant for the euro's performance in the short term. After the EUR/USD registered a decline of nearly 0.3% during the session, the European currency has managed to recover a large part of its losses.
StoneX Europe Ltd may make third party material available on this website which may contain information included but not limited to the conditions of financial markets. The material is for information purposes only and does not contain, and should not be construed as containing, investment advice and/or investment recommendation and/or an investment research and/or an offer of or solicitation for any transactions in financial instruments; any decision to enter into a specific transaction shall be made by the client following an assessment by him/her of their situation.
StoneX Europe Ltd makes no representation or warranty and assumes no liability as to the accuracy or completeness of the information provided, nor any loss arising from any investment based on a recommendation, forecast or other information supplied. You should always seek independent advice as to your suitability to speculate in any related markets and your ability to assume the associated risks, if you are at all unsure. We are not under any obligation to update any such material. Any opinion made may be personal to the author and may not reflect the opinion of StoneX Europe Ltd.