



EUR/USD, WTI Crude Oil Analysis: European Open - 4th July 2023
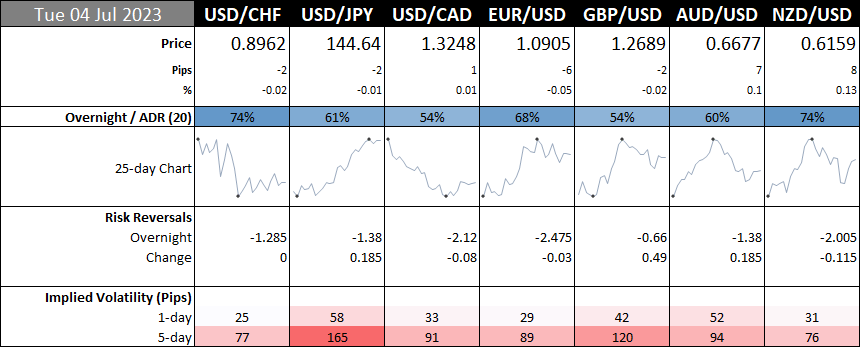
Whilst US traders return to their desks today, economic data is light so volatility may remain capped. In today's charts we look at EUR/USD and WTI crude oil, both of which show the potential to remain range-bounce, hence the preference for range-trading strategies until momentum picks up (but there is a risk it may not given the time of year).
Share this:

Asian Indices:
- Australia's ASX 200 index fell by -11.1 points (-0.15%) and currently trades at 7,235.00
- Japan's Nikkei 225 index has risen by 564.29 points (1.7%) and currently trades at 33,753.33
- Hong Kong's Hang Seng index has risen by 87.45 points (0.45%) and currently trades at 19,394.04
- China's A50 Index has fallen by -18.52 points (-0.15%) and currently trades at 12,709.49
UK and Europe:
- UK's FTSE 100 futures are currently down -1 points (-0.01%), the cash market is currently estimated to open at 7,526.26
- Euro STOXX 50 futures are currently up 4 points (0.09%), the cash market is currently estimated to open at 4,402.15
- Germany's DAX futures are currently up 23 points (0.14%), the cash market is currently estimated to open at 16,104.04
US Futures:
- DJI futures are currently down -3 points (-0.01%)
- S&P 500 futures are currently down -1.75 points (-0.04%)
- Nasdaq 100 futures are currently down -16.75 points (-0.11%)
ISM manufacturing data was weaker than expected, contracting at its fastest pace since the pandemic, with employment and new orders also contracting.
Whilst weaker ISM manufacturing data initially weakened the US dollar in yesterday’s US session, the moves were effectively reverse across all FX majors to leave a series of indecision days during low-liquidity trade. With US traders set to return to their desks today then trading volumes are expected to pick up, although a lack of US economic data could keep volatility capped until later in the week.
In fact, we have no top-tier data in the European session either, which means traders may want to refer to lower timeframes to seek opportunities around support and resistance levels until data (and potential volatility) picks up.
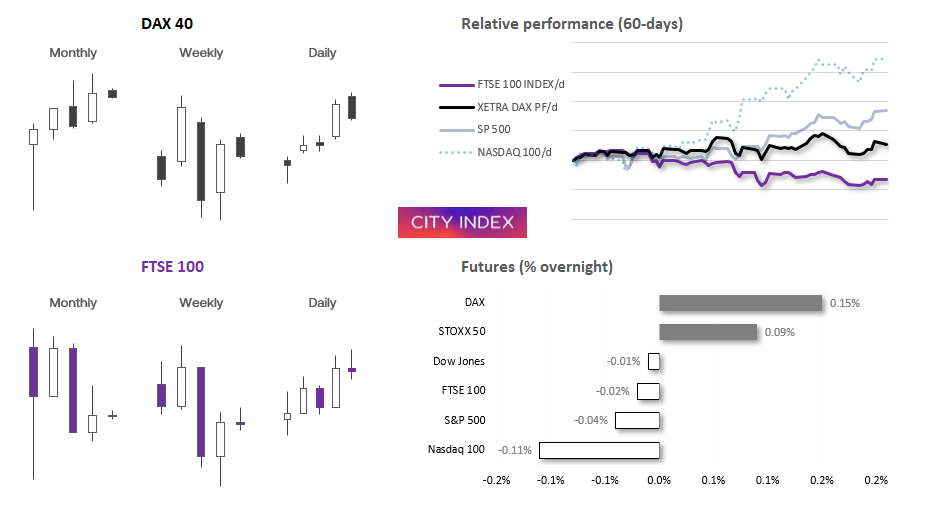
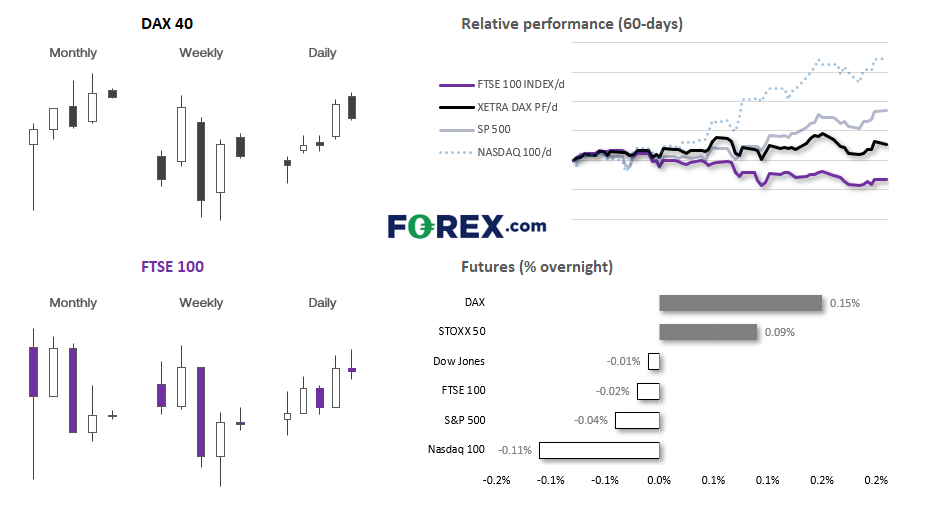
Futures markets are mixed with DAX and Stoxx 50 trading slightly higher from yesterday’s close, whilst the Dow Jones, FTSE 100, S&P 500 and Nasdaq 100 trade slightly lower. European bourse pulled back from Friday’s highs on Monday during light trade, looking past the strong lead form Asia (which was responding to weak inflation data from the US on Friday). Asian equity markets were also mixed overnight with the majority trading in small ranges and handing back some of yesterday’s gains.
EUR/USD daily chart:
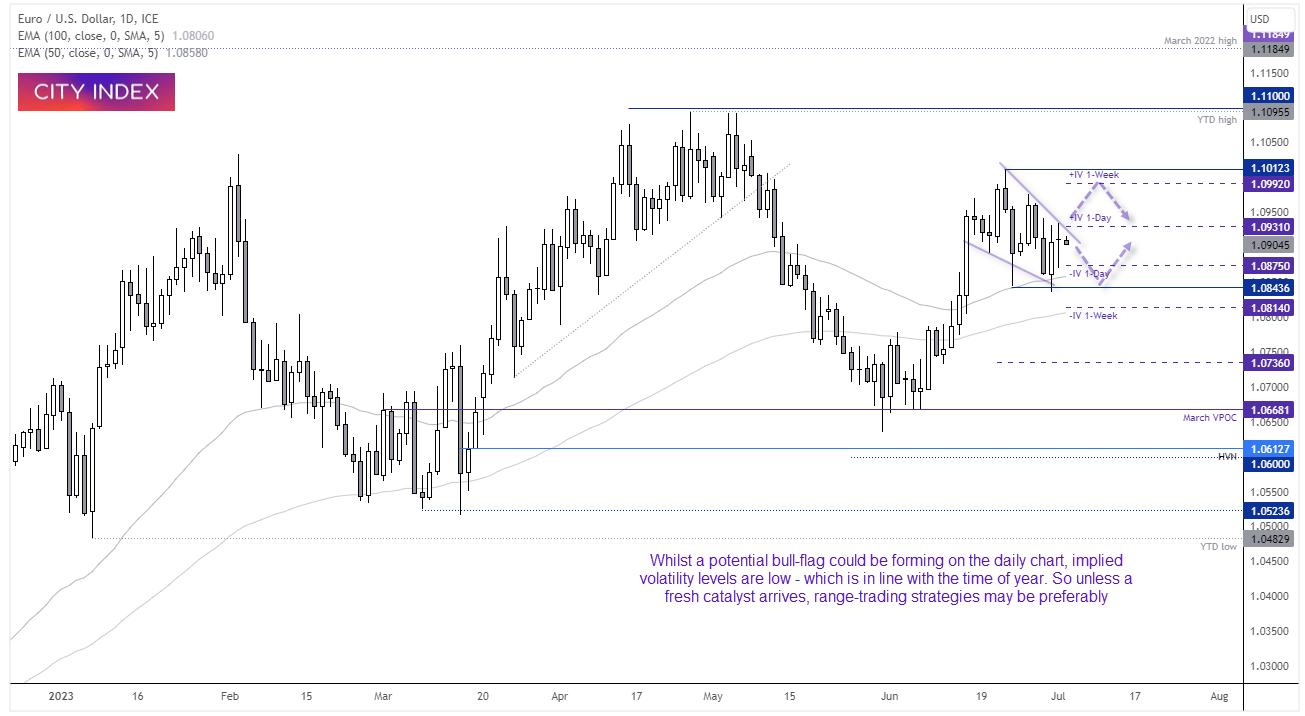
EUR/USD formed a 2-bar bullish reversal on Friday (bullish piercing line) thanks to softer US inflation and CPI expectations on Friday. The euro has continued to hold above the 50-day EMA on a closing basis and lower wicks suggests demand around 1.830/40.
However, whilst a potential bull-flag could be forming on the daily chart, implied volatility levels are low - which is in line with the time of year. So unless a fresh catalyst arrives, range-trading strategies may be preferably
EUR/GBP rose for a second week, although it was the third weekly candle with higher wicks (which accounted for the majority of the week’s range), to form inverted hammers. Ultimately, it is hard to say whether they’re bullish reversal or bearish continuation candles until we see a clear break of their highs or lows. Although price action on the daily chart appears to be a corrective rise, which could indicate a pending top and eventual break lower in line with its bearish daily trend.
GBP/USD formed a three-day bullish reversal (morning star reversal) on Friday although prices pulled back on Monday slightly. Whilst we see the potential for GBP/USD to revert to its bullish trend and head for 1.2800, we see the potential for another initial dip lower – and looking for evidence of support around the weekly pivot point / May high (1.2664/7) or volume cluster around 1.2575 before its next leg higher

WTI crude oil daily chart:
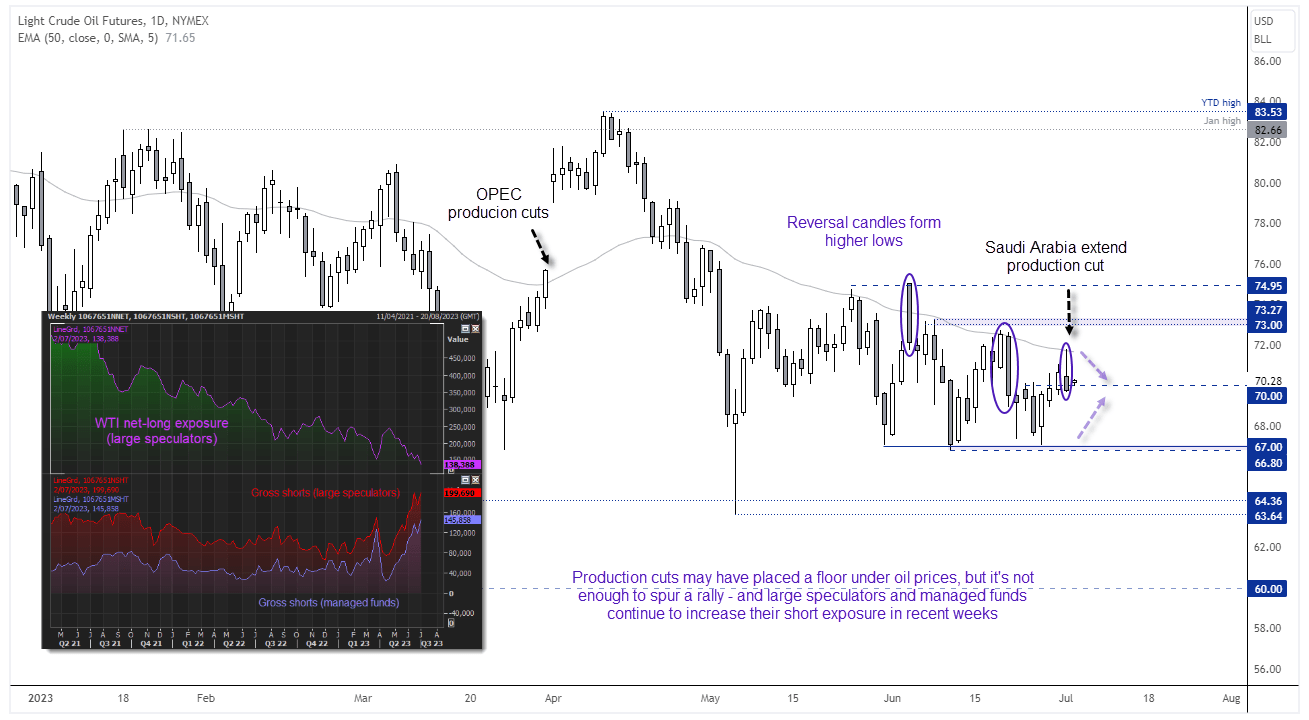
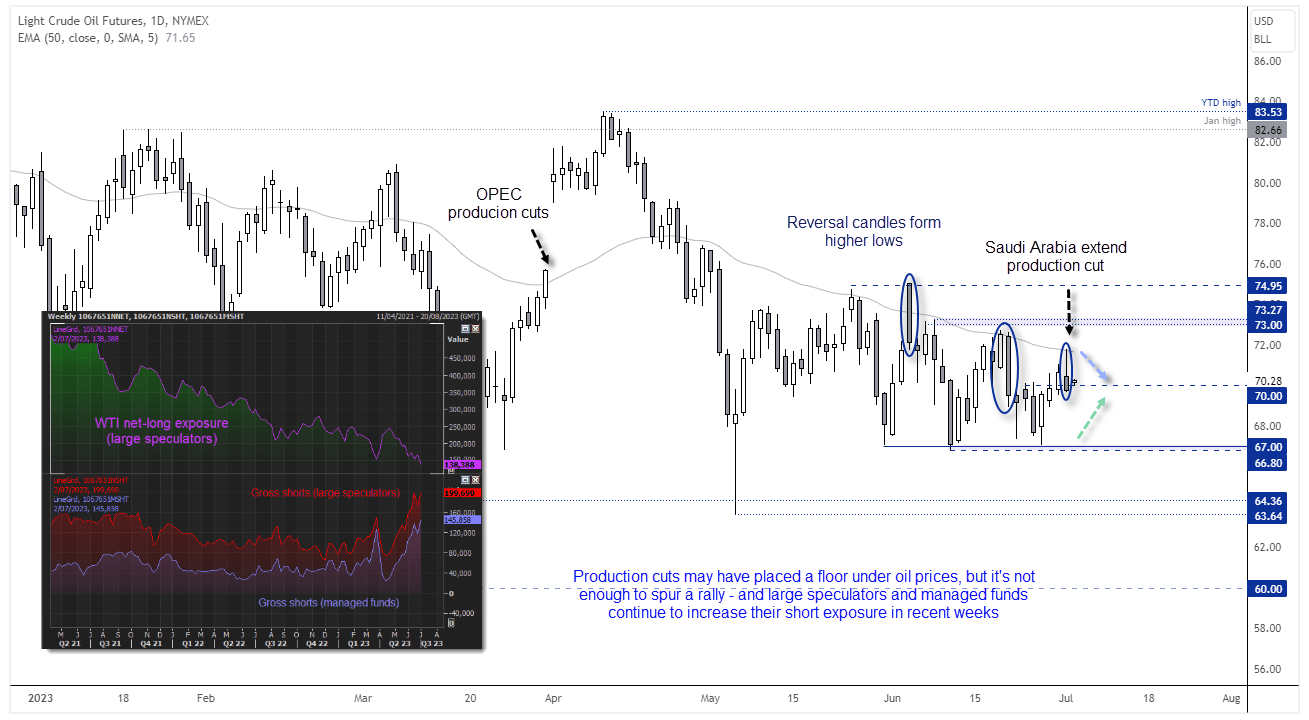
WTI crude oil failed to hold on to gains made yesterday, following news that Saudi Arabia will extend their production cap and Russia are to reduce output. A bearish hammer formed on the daily chart which respected the 50-day EMA as resistance. The fact that large speculators and managed funds have continued to increase their net-short exposure to oil in recent weeks continues to suggest rallies could be faded (sold short into), and any moves from OPEC member to cut supply is seen as more of a supporting feature in prices, but not enough to justify being aggressively long. Therefore, it may be preferably for traders to consider range-trading strategies and seek bearish opportunities around resistance levels or bullish setups around support. With prices meandering around $70, we may need to be patient to try and capture some mean reversion around the highs or lows between the $67 - $73 range on the daily chart, or refer to lower timeframes to try and capture smaller moves.
View the full economic calendar
View the full economic calendar
-- Written by Matt Simpson
Follow Matt on Twitter @cLeverEdge
How to trade with City Index
You can trade with City Index by following these four easy steps:
- Open an account, or log in if you’re already a customer
• Open an account in the UK
• Open an account in Australia
• Open an account in Singapore
- Search for the market you want to trade in our award-winning platform
- Choose your position and size, and your stop and limit levels
- Place the trade
Related tags:
Latest market news




The complete CFD trading experience
Award-winning platforms, competitive spreads, low commissions and dedicated support.
We live and breathe the markets and are dedicated to helping traders realise their ambitions as we continue to set the industry bar.
Economic calendar
Web Trader platform
Our sophisticated web-based platform is packed with features.
Related articles

Oil Quietly Hands the Fed a Reason to Stay Hawkish
Oil prices and the U.S. dollar are both on the front foot as elevated energy costs feed Fed warnings that inflation may prove sticky.


S&P 500 forecast: Stocks extend drop as correction risks grow
US and global equity markets have extended Wednesday’s sell-off, with Wall Street opening lower after a weak handover from Asia and Europe. The deterioration in risk appetite has been spreading across global markets. The dollar was firmer, Treasury yields were holding onto yesterday’s gains, while gold, silver and bitcoin were all under pressure alongside equities and major currencies.

Gold forecast: XAU/USD could take a larger dive after the big rise in yields
Gold prices have been falling in the last few days after last week’s post-FOMC pop faded amid rising interest rate expectations, higher oil prices and a strengthening US dollar. As before, I wasn’t convinced gold would thrive in the current macro backdrop.
StoneX Europe Ltd may make third party material available on this website which may contain information included but not limited to the conditions of financial markets. The material is for information purposes only and does not contain, and should not be construed as containing, investment advice and/or investment recommendation and/or an investment research and/or an offer of or solicitation for any transactions in financial instruments; any decision to enter into a specific transaction shall be made by the client following an assessment by him/her of their situation.
StoneX Europe Ltd makes no representation or warranty and assumes no liability as to the accuracy or completeness of the information provided, nor any loss arising from any investment based on a recommendation, forecast or other information supplied. You should always seek independent advice as to your suitability to speculate in any related markets and your ability to assume the associated risks, if you are at all unsure. We are not under any obligation to update any such material. Any opinion made may be personal to the author and may not reflect the opinion of StoneX Europe Ltd.