






GBP/USD, DAX analysis: European open – 21st August 2023
Index futures markets have ticked higher to suggest the bleeding from last week's selloff has receded (if not stopped). And that is despite the PBOC disappointing by not cutting a key interest rate as expected. Today we look at GBP/USD which hints at a potential swing low, and the DAX which has managed to hold above a key support zone.
Share this:

Asian Indices:
- Australia's ASX 200 index fell by -9.6 points (-0.13%) and currently trades at 7,138.50
- Japan's Nikkei 225 index has risen by 231.81 points (0.74%) and currently trades at 31,682.57
- Hong Kong's Hang Seng index has fallen by -247.77 points (-1.38%) and currently trades at 17,703.08
- China's A50 Index has fallen by -59.54 points (-0.47%) and currently trades at 12,516.17
UK and Europe:
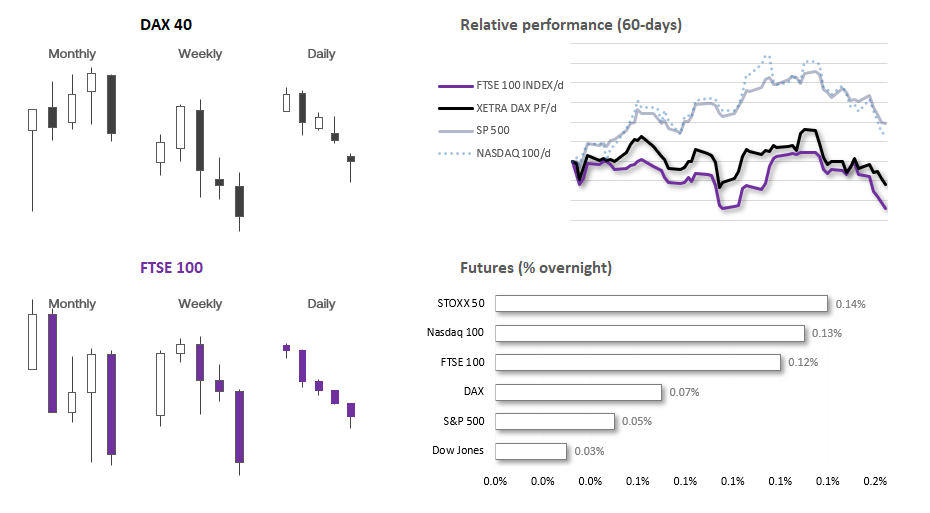
- UK's FTSE 100 futures are currently up 7 points (0.1%), the cash market is currently estimated to open at 7,269.43
- Euro STOXX 50 futures are currently up 5 points (0.12%), the cash market is currently estimated to open at 4,217.95
- Germany's DAX futures are currently up 11 points (0.07%), the cash market is currently estimated to open at 15,585.26
US Futures:
- DJI futures are currently up 6 points (0.02%)
- S&P 500 futures are currently up 1.5 points (0.03%)
- Nasdaq 100 futures are currently up 18 points (0.12%)
- The PBOC (People’s Bank of China) surprised analysts by not cutting their 5-year loan prime rate, but cut the 1-year LPR by -15bp. The 5-year is the benchmark rate for mortgages, and the consensus for a -15bp but was based on the assumption that China would want to support the property sector
- The China A50 fell to 12,400 before regaining its footing, USD/CNH rose to a 2-day high
- The FTSE 100 fell for a sixth consecutive days on Friday, although it held above its YTD low of 7206.82
- Index futures markets for Europe and the US are pointing slightly higher, which suggests the bleeding form last week has at least slowed (if not stopped).
- We see the potential for cautious gains today, as part of a technical correction if nothing else.
- Gold held above Friday’s 5-month low, although bullish momentum is sorely lacking. 1900 is a likely resistance level and just $7 higher from current levels, which could make it at pivotal level for today’s session
1-day implied volatility is above its 20-day average for all forex majors, despite no top tier economic data scheduled over the next 24 hours. Perhaps it is a combination of sub-par easing from the PBOC along with the upcoming BRICS summit and Jackson Hole symposium. But the 1-day IVs are not excessively over their average either.
We can see that ranges were very quiet during the Asian session, with NZD only moving around half of its usual range and USD/JPY below 40%.
GBP/USD technical analysis (weekly chart):
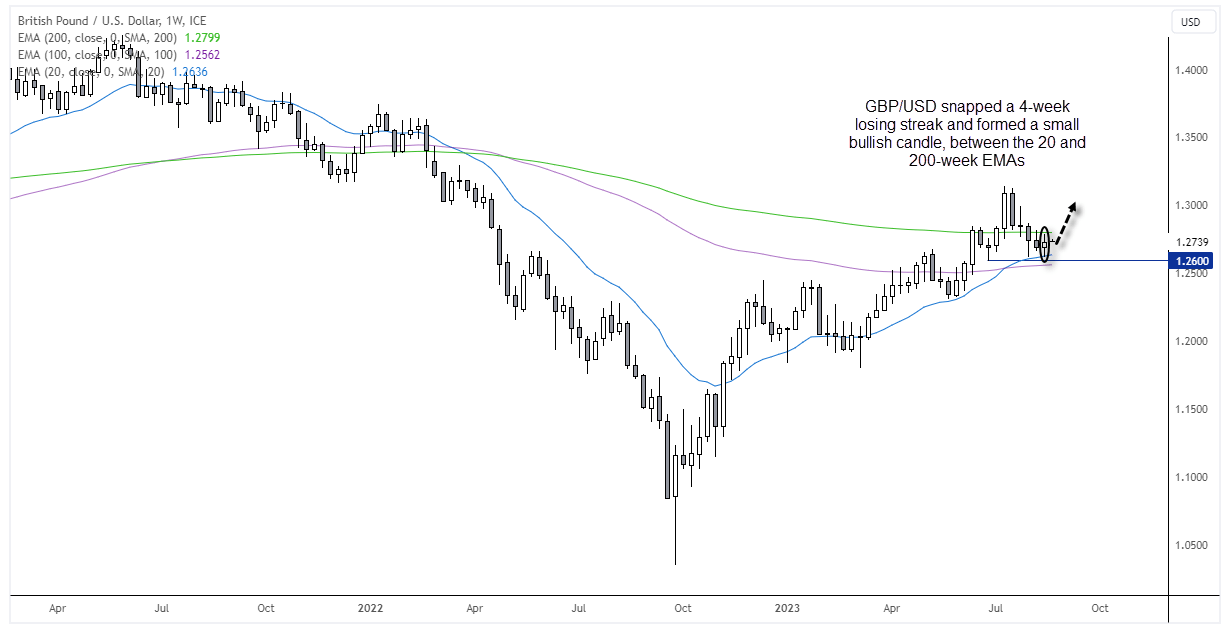
GBP/USD has delivered a textbook bullish trend on the weekly chart, since its infamous low in September 2022 due to Liz Truss’s disastrous budget plans. The 20-week EMA has provided dynamic support along the way, and came to the rescue once again at last week’s low. A small bullish candle also formed (Doji) to snap its 4-week losing streak. Perhaps e are at or near an inflection point and GBP/USD could turn higher over the coming week/s, although take note that the 200-ay EMA sits around 1.28, making it a likely level of resistance at least over the near term.
GBP/USD technical analysis (daily chart):
The daily chart shows that GBP/UD formed a double bottom just above 1.2600 with two bullish pinbars, which suggests strong demand above that key level. RSI (14) is holding above 40, a level which could be considered as oversold during a uptrend. Prices rallied for three days up to Thursday before retreating on Friday, but overall it looks like prices are trying to form a base ahead of a break back above the 200-day week EMA.
Given the Jackson Hole symposium awaits on Friday, we may find moves to be limited. But if Jerome Powell hints that the Fed are indeed done with hiking for now, it could weigh on the US dollar and help GBP/USD break higher. If so, a move back to 1.3000 seems achievable.
DAX technical analysis (daily chart)
The DAX wasted no time in getting dragged lower with negative sentiment on Friday, which saw the German bourse break beneath the lower trendline of its bullish channel. However, given the market help above a key support zone, it does leave the potential for a bounce (at least over the near-term).
Friday’s candle was a bullish pinbar just above the July low and 50% retracement level, just above the 200-day EMA. RSI (2) also reached oversold on Friday, and index future point to a firmer open today, following a stronger lead from Wall Street om Friday. Whilst prices remain above last week’s low, the bias is for a bounce to 15,750 – a break above which brings 16,000 back into focus.
View the full economic calendar
View the full economic calendar
-- Written by Matt Simpson
Follow Matt on Twitter @cLeverEdge
How to trade with City Index
You can trade with City Index by following these four easy steps:
- Open an account, or log in if you’re already a customer
• Open an account in the UK
• Open an account in Australia
• Open an account in Singapore
- Search for the market you want to trade in our award-winning platform
- Choose your position and size, and your stop and limit levels
- Place the trade
Related tags:


The complete CFD trading experience
Award-winning platforms, competitive spreads, low commissions and dedicated support.
We live and breathe the markets and are dedicated to helping traders realise their ambitions as we continue to set the industry bar.
Economic calendar
Web Trader platform
Our sophisticated web-based platform is packed with features.
Related articles

Dow Jones forecast: Stock markets under pressure from multiple sources
When looking at the major tech-heavy US indices like the S&P 500 or the Nasdaq 100, you wouldn’t think that the stock market is particularly weak. Yet, beneath the surface, the market is far from healthy right now. Investors are evidently just piling into the big tech and AI names, and as a result, market breadth is deteriorating. Other indices like the small cap Russell 2000 and the Dow Jones are starting to reflect that weakness.


Nikkei breakout accelerates as yen weakness returns
Nikkei has started October with a powerful breakout, helped by renewed yen weakness and strong upside momentum


The RBA Hiked Rates and the Australian Dollar Still Fell
AUD/USD fell after the RBA rate hike because the central bank's hawkish stance was already priced in while the U.S. dollar stayed firm.
StoneX Europe Ltd may make third party material available on this website which may contain information included but not limited to the conditions of financial markets. The material is for information purposes only and does not contain, and should not be construed as containing, investment advice and/or investment recommendation and/or an investment research and/or an offer of or solicitation for any transactions in financial instruments; any decision to enter into a specific transaction shall be made by the client following an assessment by him/her of their situation.
StoneX Europe Ltd makes no representation or warranty and assumes no liability as to the accuracy or completeness of the information provided, nor any loss arising from any investment based on a recommendation, forecast or other information supplied. You should always seek independent advice as to your suitability to speculate in any related markets and your ability to assume the associated risks, if you are at all unsure. We are not under any obligation to update any such material. Any opinion made may be personal to the author and may not reflect the opinion of StoneX Europe Ltd.