





GBP/USD Technical Analysis: Cable Bullish Continuation
GBP/USD is nearing a fresh two-month-high and the pair can remain as one of the more attractive venues for a continuation of U.S. Dollar weakness.
Share this:

GBP/USD Talking Points:
- While EUR/USD has continued to struggle around the 1.0500 area, the bullish trend in Cable (GBP/USD) has been clearer, with the pair setting a fresh two-month-high last week.
- Last week’s USD rally drove pullbacks in many majors, GBP/USD included, but the pair held support at a key Fibonacci level, and an area of prior resistance, to keep the door open for fresh highs.
- I look at GBP/USD along with other major FX pairs each week in the Tuesday webinar. Click here for registration information.
GBP/USD is off to a fast start to the week, challenging the two-month-high that was set last Wednesday after the first test above 1.2700 in 2025 trade. USD-strength returned on Thursday and Friday, and this showed in most major pairs, but in GBP/USD, price found support at a Fibonacci level of note, plotted at 1.2571 and this is confluent with a prior swing-high from the opening days of the New Year.
As I’ve been discussing in webinars of late, GBP/USD could remain as a preferable major pair for scenarios of USD-weakness, especially against EUR/USD which has continued to hold resistance at the same level that marked the highs back in January.
For next resistance in GBP/USD, the 50% mark of the same Fibonacci retracement that helped to set support at the 61.8% plots just overhead, at 1.2736. Just above that at 1.2758 is another Fibonacci level of note, as the 61.8% retracement of the 2021-2022 major move provides a bit of confluence; and above that is the 200-day moving average, currently plotted at 1.2788.
GBP/USD Daily Chart
 Chart prepared by James Stanley; data derived from Tradingview
GBP/USD Weekly
For context, it’s been a fast turn so far in 2025 and while the below chart bears resemblance to a V-shaped reversal, it also highlights the challenge of chasing a well-developed move that’s nearing a big batch of confluent resistance potential. There’s also a price of note at 1.2630, which can come into play as higher-low support for bullish continuation. This was the high three weeks ago, when bulls were finally able to prod a breakout above the 1.2500 psychological level. That was also the close for the week after and the open for last week, so there’s a bit of historical reference there, as well.
GBP/USD Weekly Chart
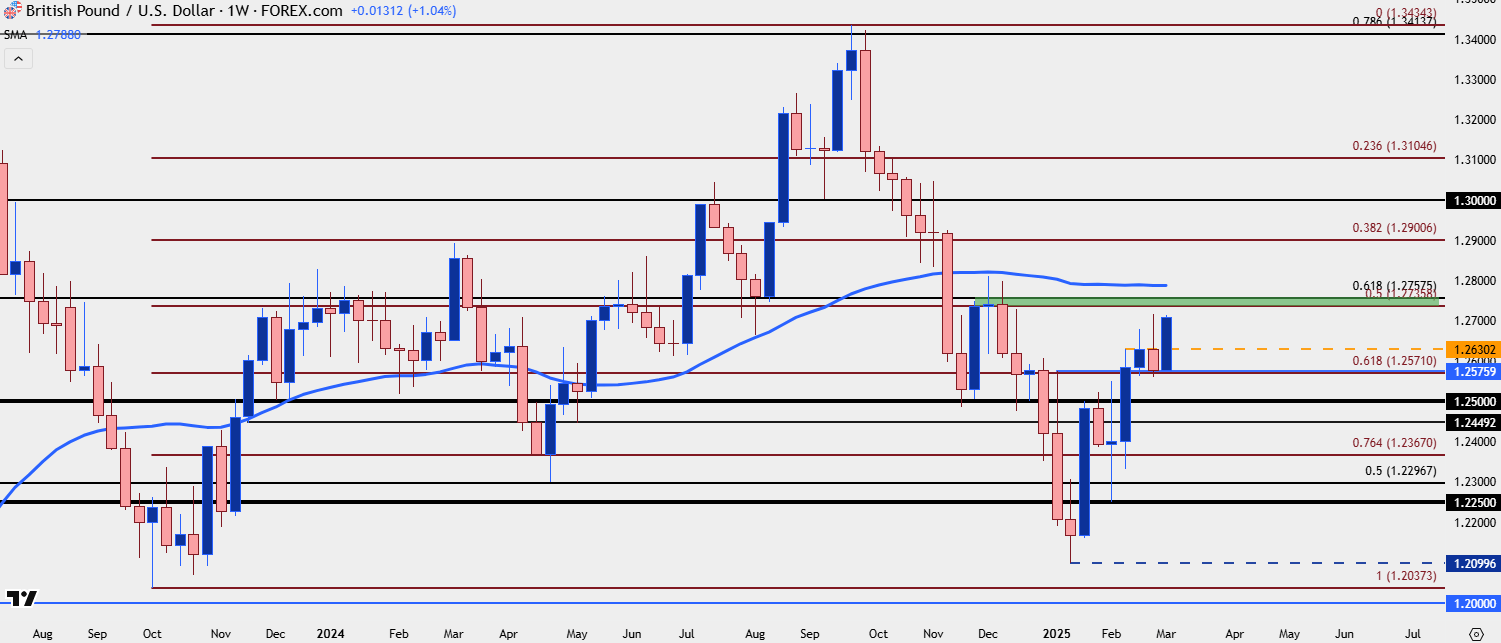 Chart prepared by James Stanley; data derived from Tradingview
--- written by James Stanley, Senior Strategist
GBP/USD Talking Points:
- While EUR/USD has continued to struggle around the 1.0500 area, the bullish trend in Cable (GBP/USD) has been clearer, with the pair setting a fresh two-month-high last week.
- Last week’s USD rally drove pullbacks in many majors, GBP/USD included, but the pair held support at a key Fibonacci level, and an area of prior resistance, to keep the door open for fresh highs.
- I look at GBP/USD along with other major FX pairs each week in the Tuesday webinar. Click here for registration information.
GBP/USD is off to a fast start to the week, challenging the two-month-high that was set last Wednesday after the first test above 1.2700 in 2025 trade. USD-strength returned on Thursday and Friday, and this showed in most major pairs, but in GBP/USD, price found support at a Fibonacci level of note, plotted at 1.2571 and this is confluent with a prior swing-high from the opening days of the New Year.
As I’ve been discussing in webinars of late, GBP/USD could remain as a preferable major pair for scenarios of USD-weakness, especially against EUR/USD which has continued to hold resistance at the same level that marked the highs back in January.
For next resistance in GBP/USD, the 50% mark of the same Fibonacci retracement that helped to set support at the 61.8% plots just overhead, at 1.2736. Just above that at 1.2758 is another Fibonacci level of note, as the 61.8% retracement of the 2021-2022 major move provides a bit of confluence; and above that is the 200-day moving average, currently plotted at 1.2788.
GBP/USD Daily Chart
GBP/USD Weekly
For context, it’s been a fast turn so far in 2025 and while the below chart bears resemblance to a V-shaped reversal, it also highlights the challenge of chasing a well-developed move that’s nearing a big batch of confluent resistance potential. There’s also a price of note at 1.2630, which can come into play as higher-low support for bullish continuation. This was the high three weeks ago, when bulls were finally able to prod a breakout above the 1.2500 psychological level. That was also the close for the week after and the open for last week, so there’s a bit of historical reference there, as well.
GBP/USD Weekly Chart
--- written by James Stanley, Senior Strategist
Related tags:



The complete CFD trading experience
Award-winning platforms, competitive spreads, low commissions and dedicated support.
We live and breathe the markets and are dedicated to helping traders realise their ambitions as we continue to set the industry bar.
Economic calendar
Web Trader platform
Our sophisticated web-based platform is packed with features.
Related articles

Japanese Yen Technical Analysis: USD/JPY Support Test into Core PCE
USD/JPY has been a battlefield for the past two months as the force of intervention and the threat of more have given sellers an advantage, even as buyers have continued to bid support on pullbacks. This sets the stage for a massive finish to the week with Core PCE and Non-farm Payrolls.

Euro Forecast: EUR/USD Tumbles Towards Yearly Low as Daily RSI Goes Oversold
EUR/USD has been hit hard in the final month of the quarter as USD strength has shown up in a big way. With the pair set to challenge its yearly low as RSI has pushed into oversold territory, is there a chance for a pullback with some big headline risk hitting in the US over the next few days?

USD into a Massive Week as Yields Fly and Gold Breaks
It’s a huge week with PCE and NFP, but it’s what’s happening off of the calendar that demands attention with US yields flying to fresh multi-decade highs.
StoneX Europe Ltd may make third party material available on this website which may contain information included but not limited to the conditions of financial markets. The material is for information purposes only and does not contain, and should not be construed as containing, investment advice and/or investment recommendation and/or an investment research and/or an offer of or solicitation for any transactions in financial instruments; any decision to enter into a specific transaction shall be made by the client following an assessment by him/her of their situation.
StoneX Europe Ltd makes no representation or warranty and assumes no liability as to the accuracy or completeness of the information provided, nor any loss arising from any investment based on a recommendation, forecast or other information supplied. You should always seek independent advice as to your suitability to speculate in any related markets and your ability to assume the associated risks, if you are at all unsure. We are not under any obligation to update any such material. Any opinion made may be personal to the author and may not reflect the opinion of StoneX Europe Ltd.