



Gold soars and stands above the 2000
Yesterday, spot gold jumped 2.1% with a close price at $2.019, breaking above the psychological level at $2,000 and hitting the all time high. Investors continue to support gold on the uncertainty of economic and geopolitical risk.
Share this:

Yesterday, spot gold jumped 2.1% with a close price at $2.019, breaking above the psychological level at $2,000 and hitting the all time high. Investors continue to support gold on the uncertainty of economic and geopolitical risk.
In fact, investors continue to wait for the result of the negotiations between Democrats and Republicans on new coronavirus relief measures.
The gold holding of global gold-backed ETF rose to 3,365.6 tons on Monday, up 30.5% this year, according to Bloomberg. The ETF's holding is being the second of the world, surpassing Germany's holding.
Recently, investment bank Goldman Sachs raised the 12-month price forecast of gold from $2,000 to $2,300 on weaker U.S. dollar, rising geopolitical tensions and the U.S. domestic and social uncertainty.
Gold (Short Term): Further upside expected

Source: GAIN Capital, TradingView
On a daily chart, spot gold continues to shoot up after taking a breath for around 1-week.
The relative strength index stayed around its overbought level at 80, suggesting the extreme upside momentum for the prices.
The nearest support level is located at $1,935 (the low of consolidation area), while the resistance levels would be located at $2,070 and $2,130.
Gold (Intraday): Bullish bias above $1,980
Source: Gain Capital, TradingView
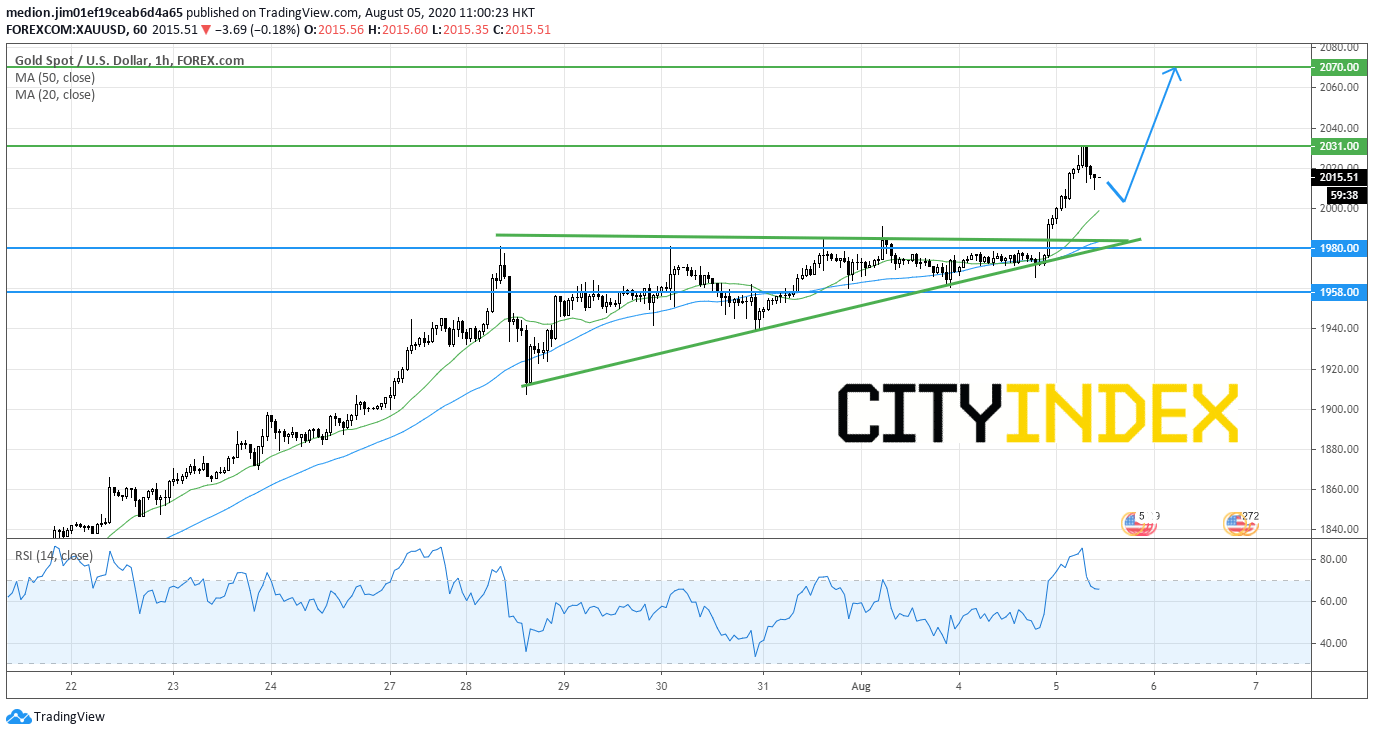
On a 1-hour chart, spot gold confirmed a breakout of the ascending triangle, suggesting the resumption of the recent bullish trend.
Currently, the prices posted a pullback after running up to $2,031, but the prices remain supported by both rising 20-period and 50-period moving averages.
Hence, as long as the support level at $1,980 (around the neckline of ascending triangle) is not broken, spot gold should bring a retest of the previous high at $2,031 before rising to the second resistance level at $2,070.
In fact, investors continue to wait for the result of the negotiations between Democrats and Republicans on new coronavirus relief measures.
The gold holding of global gold-backed ETF rose to 3,365.6 tons on Monday, up 30.5% this year, according to Bloomberg. The ETF's holding is being the second of the world, surpassing Germany's holding.
Recently, investment bank Goldman Sachs raised the 12-month price forecast of gold from $2,000 to $2,300 on weaker U.S. dollar, rising geopolitical tensions and the U.S. domestic and social uncertainty.
Gold (Short Term): Further upside expected
Source: GAIN Capital, TradingView
On a daily chart, spot gold continues to shoot up after taking a breath for around 1-week.
The relative strength index stayed around its overbought level at 80, suggesting the extreme upside momentum for the prices.
The nearest support level is located at $1,935 (the low of consolidation area), while the resistance levels would be located at $2,070 and $2,130.
Gold (Intraday): Bullish bias above $1,980
Source: Gain Capital, TradingView
On a 1-hour chart, spot gold confirmed a breakout of the ascending triangle, suggesting the resumption of the recent bullish trend.
Currently, the prices posted a pullback after running up to $2,031, but the prices remain supported by both rising 20-period and 50-period moving averages.
Hence, as long as the support level at $1,980 (around the neckline of ascending triangle) is not broken, spot gold should bring a retest of the previous high at $2,031 before rising to the second resistance level at $2,070.
Yesterday, spot gold jumped 2.1% with a close price at $2.019, breaking above the psychological level at $2,000 and hitting the all time high. Investors continue to support gold on the uncertainty of economic and geopolitical risk.
In fact, investors continue to wait for the result of the negotiations between Democrats and Republicans on new coronavirus relief measures.
The gold holding of global gold-backed ETF rose to 3,365.6 tons on Monday, up 30.5% this year, according to Bloomberg. The ETF's holding is being the second of the world, surpassing Germany's holding.
Recently, investment bank Goldman Sachs raised the 12-month price forecast of gold from $2,000 to $2,300 on weaker U.S. dollar, rising geopolitical tensions and the U.S. domestic and social uncertainty.
Gold (Short Term): Further upside expected

Source: GAIN Capital, TradingView
On a daily chart, spot gold continues to shoot up after taking a breath for around 1-week.
The relative strength index stayed around its overbought level at 80, suggesting the extreme upside momentum for the prices.
The nearest support level is located at $1,935 (the low of consolidation area), while the resistance levels would be located at $2,070 and $2,130.
Gold (Intraday): Bullish bias above $1,980
Source: Gain Capital, TradingView
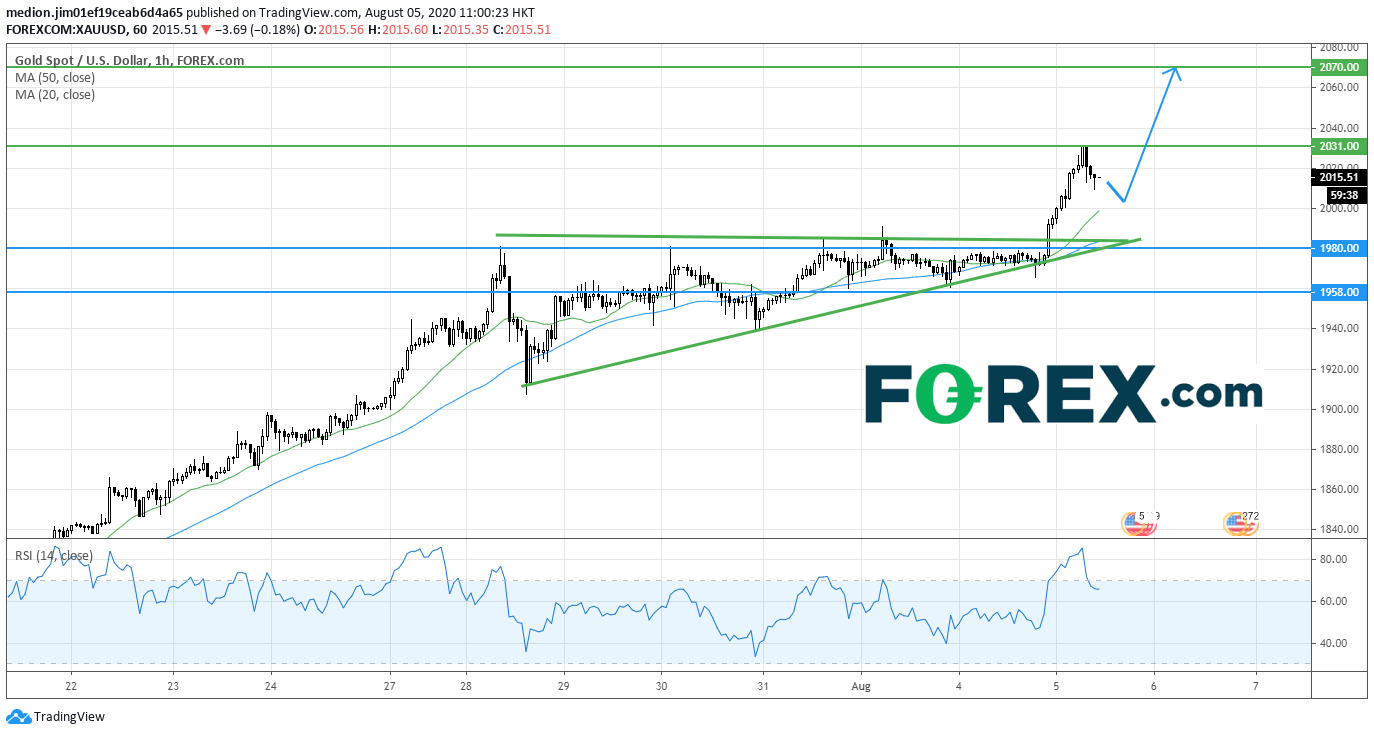
On a 1-hour chart, spot gold confirmed a breakout of the ascending triangle, suggesting the resumption of the recent bullish trend.
Currently, the prices posted a pullback after running up to $2,031, but the prices remain supported by both rising 20-period and 50-period moving averages.
Hence, as long as the support level at $1,980 (around the neckline of ascending triangle) is not broken, spot gold should bring a retest of the previous high at $2,031 before rising to the second resistance level at $2,070.
In fact, investors continue to wait for the result of the negotiations between Democrats and Republicans on new coronavirus relief measures.
The gold holding of global gold-backed ETF rose to 3,365.6 tons on Monday, up 30.5% this year, according to Bloomberg. The ETF's holding is being the second of the world, surpassing Germany's holding.
Recently, investment bank Goldman Sachs raised the 12-month price forecast of gold from $2,000 to $2,300 on weaker U.S. dollar, rising geopolitical tensions and the U.S. domestic and social uncertainty.
Gold (Short Term): Further upside expected
Source: GAIN Capital, TradingView
On a daily chart, spot gold continues to shoot up after taking a breath for around 1-week.
The relative strength index stayed around its overbought level at 80, suggesting the extreme upside momentum for the prices.
The nearest support level is located at $1,935 (the low of consolidation area), while the resistance levels would be located at $2,070 and $2,130.
Gold (Intraday): Bullish bias above $1,980
Source: Gain Capital, TradingView
On a 1-hour chart, spot gold confirmed a breakout of the ascending triangle, suggesting the resumption of the recent bullish trend.
Currently, the prices posted a pullback after running up to $2,031, but the prices remain supported by both rising 20-period and 50-period moving averages.
Hence, as long as the support level at $1,980 (around the neckline of ascending triangle) is not broken, spot gold should bring a retest of the previous high at $2,031 before rising to the second resistance level at $2,070.
Related tags:


The complete CFD trading experience
Award-winning platforms, competitive spreads, low commissions and dedicated support.
We live and breathe the markets and are dedicated to helping traders realise their ambitions as we continue to set the industry bar.
Economic calendar
Web Trader platform
Our sophisticated web-based platform is packed with features.
Related articles

Oil, Gold Forecast: Two trades to watch 280926
Oil Rises as U.S.-Iran Peace Hopes Fade. Gold Breaks Down on Hawkish Fed Expectations as Treasury Yields and USD Rise.


Gold Outlook: XAU/USD hit hard as US yields, dollar resume ascent
A stronger dollar, surging front-end yields and renewed geopolitical tension have combined to push gold back towards key technical support.


Gold Price Forecast: XAU/USD Avoids Breakdown as Yields Surged but Can it Continue?
Surging Treasury yields sent a jolt across markets last week but, so far, gold prices have held above the FOMC low. The big question now is whether that can continue and, if not, will bulls show up at $4100 or $4k like they did in June and July?

StoneX Europe Ltd may make third party material available on this website which may contain information included but not limited to the conditions of financial markets. The material is for information purposes only and does not contain, and should not be construed as containing, investment advice and/or investment recommendation and/or an investment research and/or an offer of or solicitation for any transactions in financial instruments; any decision to enter into a specific transaction shall be made by the client following an assessment by him/her of their situation.
StoneX Europe Ltd makes no representation or warranty and assumes no liability as to the accuracy or completeness of the information provided, nor any loss arising from any investment based on a recommendation, forecast or other information supplied. You should always seek independent advice as to your suitability to speculate in any related markets and your ability to assume the associated risks, if you are at all unsure. We are not under any obligation to update any such material. Any opinion made may be personal to the author and may not reflect the opinion of StoneX Europe Ltd.