


Gold Update: XAU/USD struggles for direction near 4k
Although gold has gained close to 1.5% over the last 2 trading sessions, this move does not yet appear to confirm a dominant buying bias. For now, the metal continues to show a more neutral behavior, with demand strength still failing to recover fully after the release of PPI inflation data in the United States.
Share this:

Although gold has gained close to 1.5% over the last 2 trading sessions, this move does not yet appear to confirm a dominant buying bias. For now, the metal continues to show a more neutral behavior, with demand strength still failing to recover fully after the release of PPI inflation data in the United States.
This is partly because, although inflation pressures have started to show signs of moderation, the bond market continues to show strength and remains a relevant substitute market for gold. This dynamic could keep a phase of indecision important in short-term XAU/USD movements.


PPI data is released
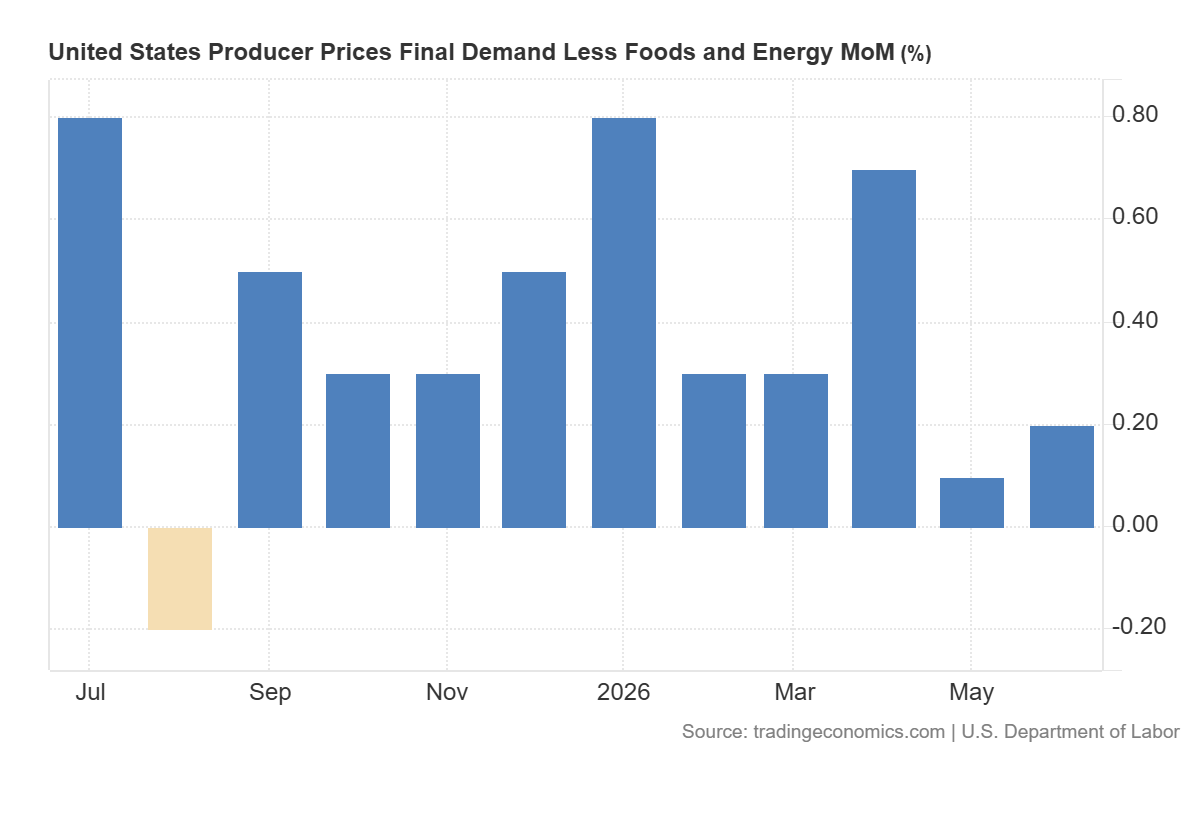
During the session, Core PPI data in the United States was released. This corresponds to the producer price index and works as an additional metric to measure potential inflation pressures.
The data came in below expectations, with a reading of 0.2% versus an expected monthly figure of 0.3%. For now, the dynamic shows that producer prices have continued to register low readings since May, moving away from the elevated levels seen in April, when the figure reached 0.7%.
Together with the CPI data released in the previous session, this figure shows that inflation pressures in the United States have started to ease to some extent.
Source: TradingEconomics
After the impact of the inflation data released over the last 2 sessions, an interesting shift has started to appear in expectations around a potentially more aggressive Federal Reserve.
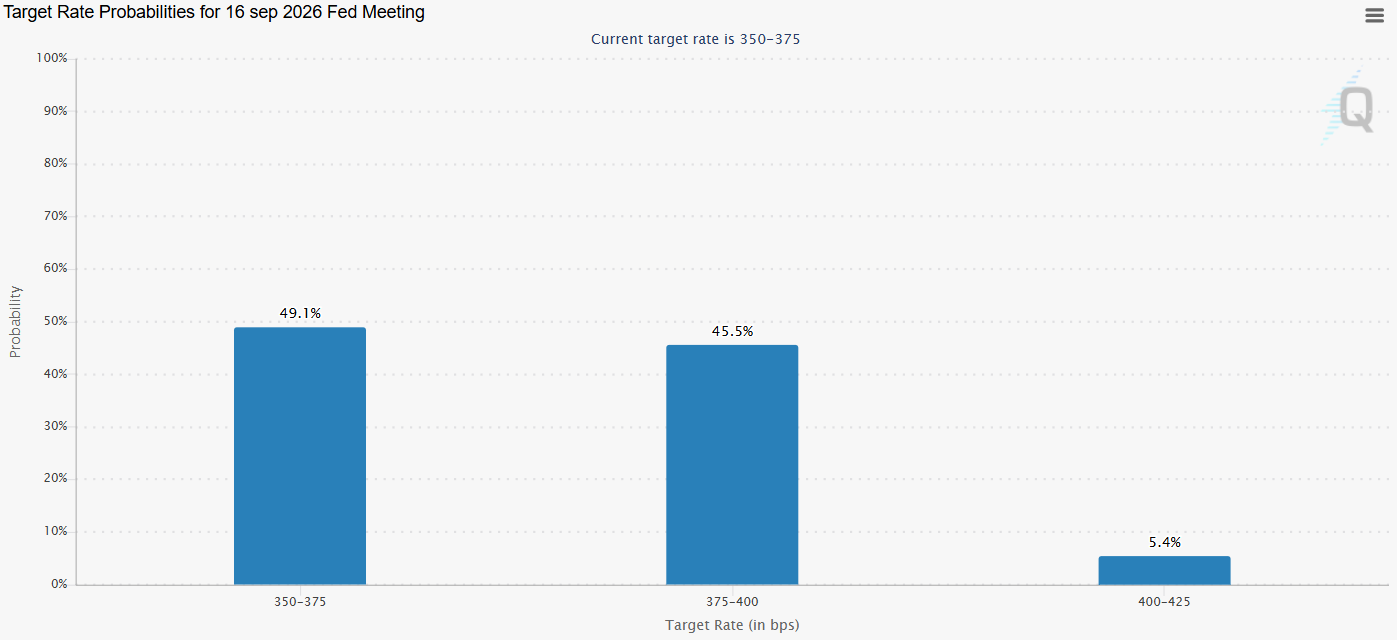
Now, the probability table shows a 49.1% chance that interest rates will remain unchanged at the September 16 decision. At the same time, there is a lower probability, at 45.5%, of a 0.25% increase in U.S. interest rates, which would take them to a new reference area of 4.00%.
This suggests that expectations of a more aggressive stance from the central bank may not materialize as soon as previously expected, partly due to the recently released inflation data.
Source: CMEGROUP
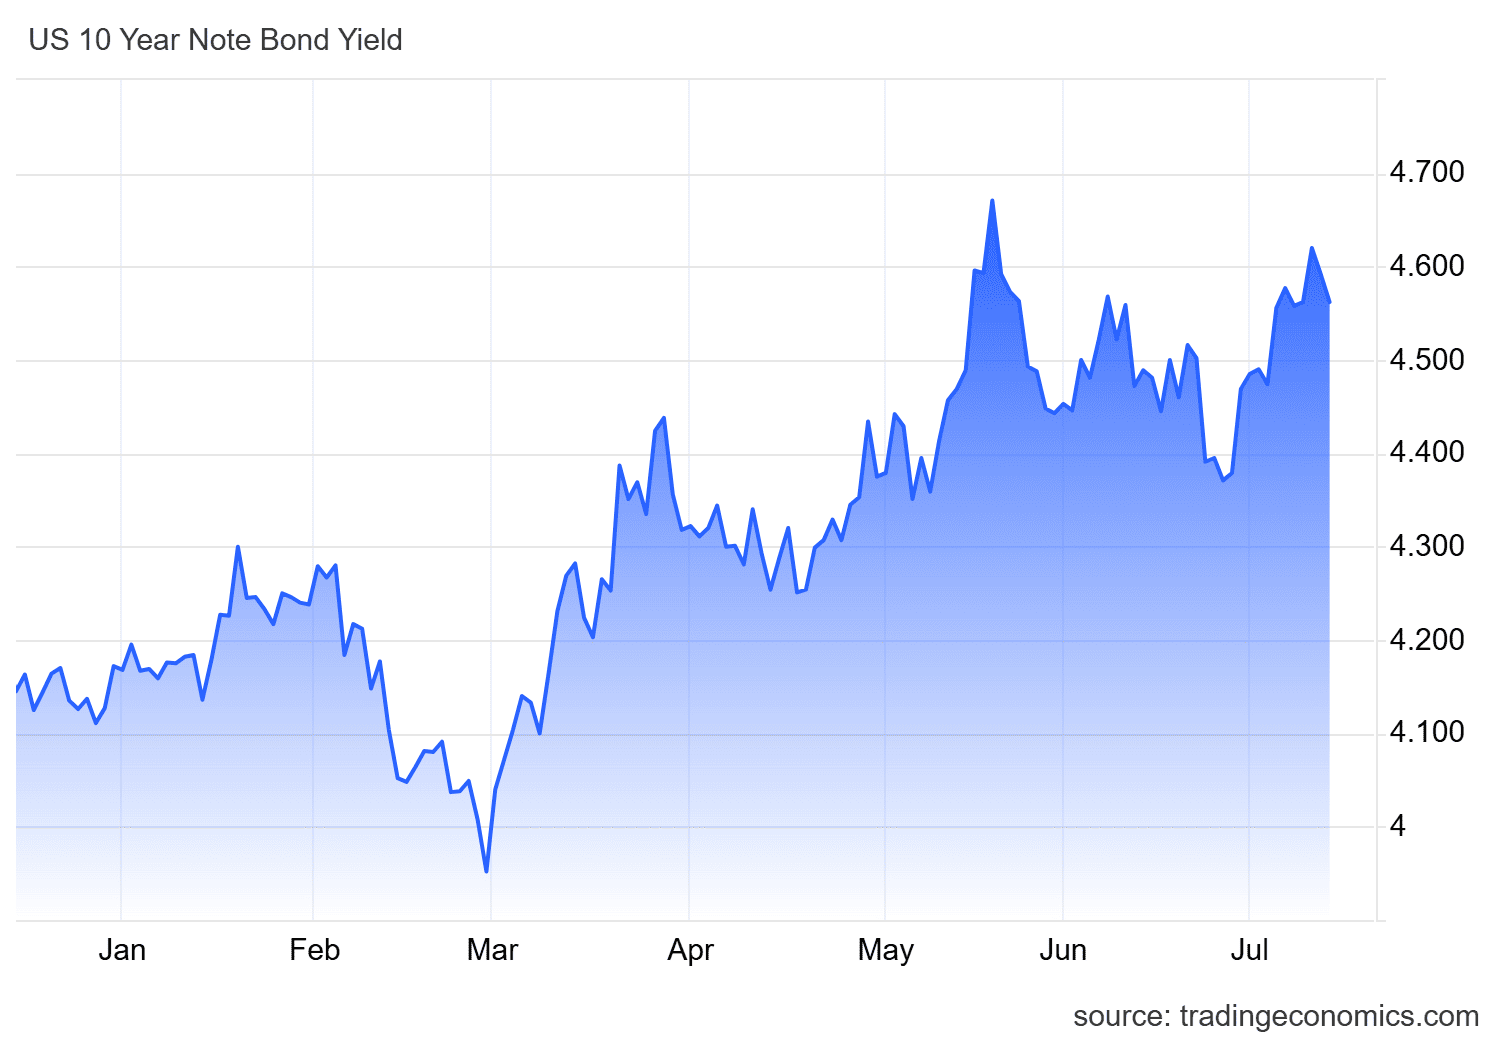
However, the most relevant factor for gold movements remains the dynamic of the 10-year U.S. bond market, considered one of the metal’s most important substitute markets.
Although a less aggressive central bank is now expected compared to what was projected weeks ago, bond yields have not shown major changes after the inflation data. While a recent decline has been observed, it has been small compared to the growth seen in previous weeks and yields still remain above the 4.5% area.
Source: TradingEconomics
This dynamic is not entirely favorable for gold because, unlike bonds, the metal does not pay interest. For this reason, it may be perceived as a less attractive market while bond yields remain stable and elevated in the short term.
In this context, strong yields could be reducing gold’s appeal and favoring a shift of capital flows toward substitute markets such as bonds.
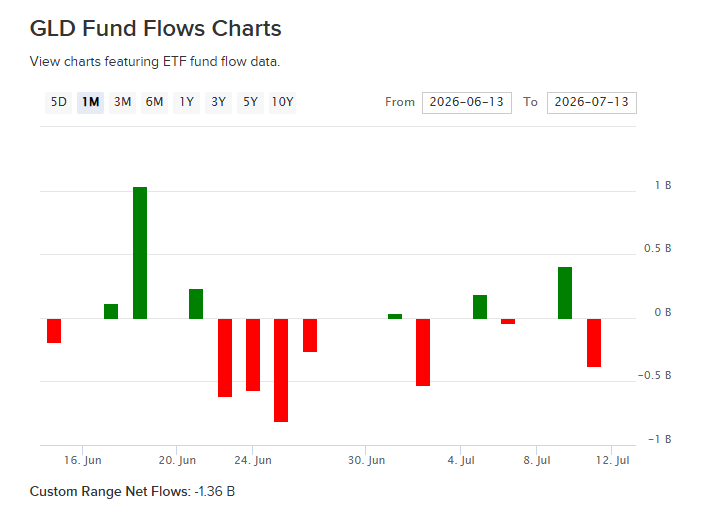
In fact, demand dynamics in the most relevant gold ETF, SPDR Gold Shares, show a lack of positive net flows over the last month of trading. For the most recent date, July 10, capital outflows of more than 350 million dollars were recorded.
This shows that capital outflows have reflected weaker appetite for gold, while the bond market has shown an important increase in yields over the last month. Overall, this dynamic highlights gold’s loss of appeal compared to substitute markets.
Source: ETFDB
With all the above in mind, one of the factors limiting a stronger recovery in gold demand may be the strength of its substitute markets. If this effect continues, it could keep preventing more consistent buying pressure from reaching the metal.
For this reason, a relevant phase of indecision could remain part of gold’s movements over the next few trading sessions.
Technical outlook for gold
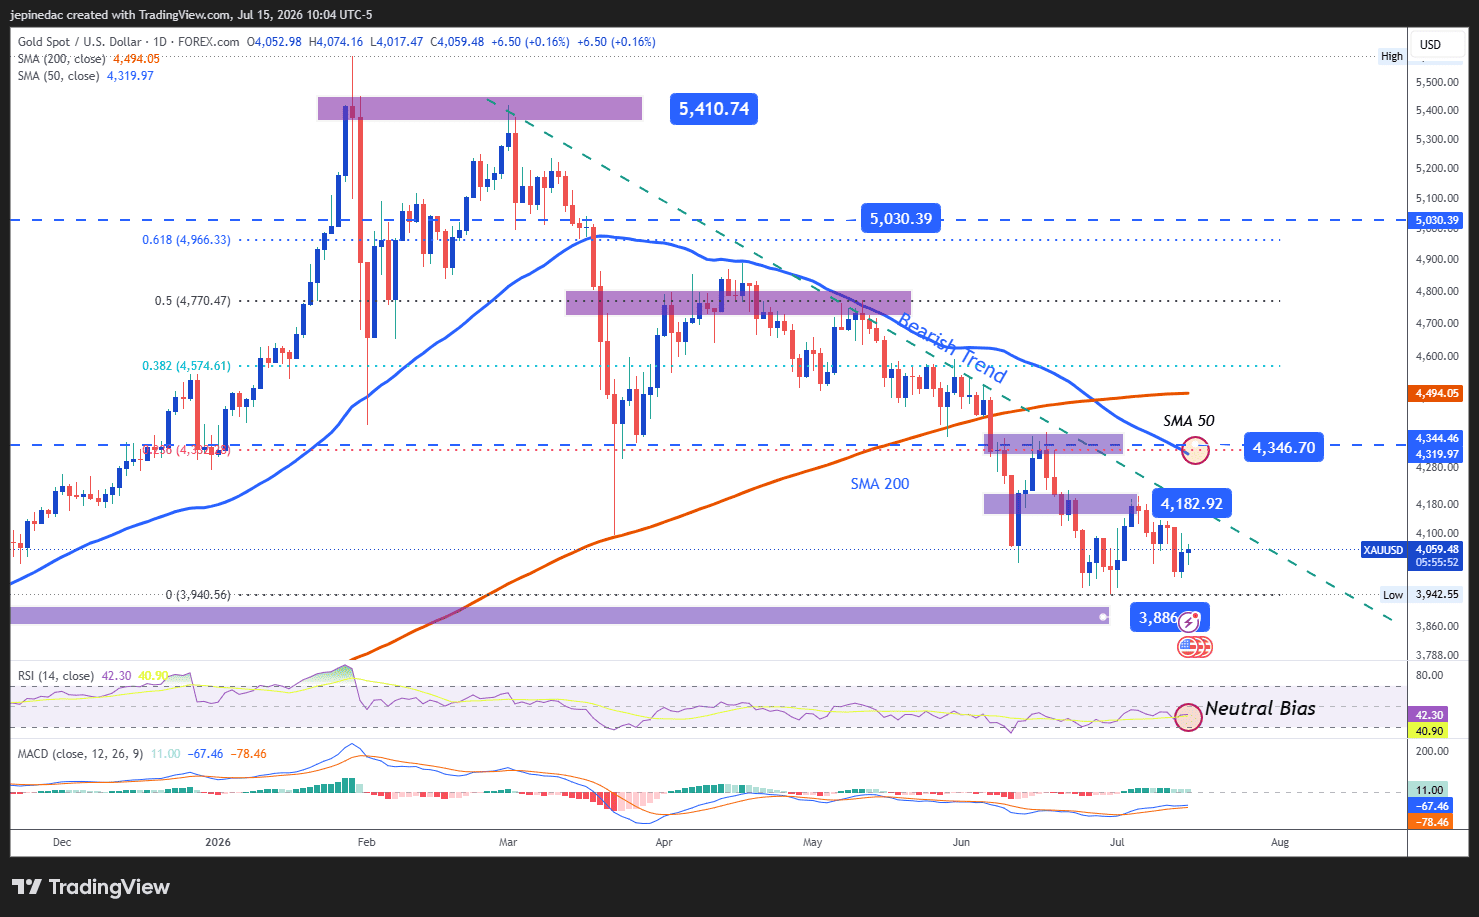
Source: StoneX, Tradingview
- The bearish trend line remains relevant: Despite gold’s recovery attempts in previous sessions, bullish movements still appear insufficient compared to the selling structure that has dominated the daily chart since the first days of March 2026. So far, this trend line remains the most important technical structure to watch. However, if price stops forming new relevant lows, a phase of neutrality could start to put the bearish formation at risk and open room for a possible sideways range over the next few sessions.
- RSI: Now, the RSI line has started to move near the neutral 50 level. This suggests a balance in the average of bullish and bearish impulses over the last 14 sessions. This dynamic reflects a possible indecision bias that has started to become relevant in the chart’s movements and could continue if the indicator maintains this behavior.
- MACD: A similar reading can be seen in the MACD, as the histogram remains near the neutral 0 area. This suggests that the average strength of short-term moving averages is in neutral territory, reinforcing the possibility of a phase of indecision in gold.
Key levels to watch:
- 4,345 USD – Crucial resistance: This level corresponds to relevant highs from recent weeks and aligns with the barrier marked by the 50-period simple moving average and the 23.6% Fibonacci retracement of the most relevant move on the chart. Price movements toward this level could put the large bearish trend line formation at risk and open room for a more dominant buying bias over the coming weeks.
- 4,182 USD – Near-term barrier: This recent neutral zone coincides with important retracements from recent weeks. If price remains too close to this level, a phase of indecision could be reinforced and even open room for a short-term sideways range.
- 3,886 USD – Critical support: This level is associated with relevant lows from October 2025 and is considered the next most important bearish barrier. Moves toward this area could once again highlight a clearer selling bias and extend the bearish trend line as the dominant technical structure over the coming weeks.
Written by Julian Pineda, CFA, CMT – Market Analyst
Follow him on: @julianpineda25
Related tags:
Latest market news




The complete CFD trading experience
Award-winning platforms, competitive spreads, low commissions and dedicated support.
We live and breathe the markets and are dedicated to helping traders realise their ambitions as we continue to set the industry bar.
Economic calendar
Web Trader platform
Our sophisticated web-based platform is packed with features.
Related articles
Gold Dips Below Three-Month Uptrend, Bitcoin Pulls Back from Nine-Month High
Gold has dipped below its three-month uptrend, while Bitcoin has pulled back from a nine-month high as U.S. bond yields test levels last seen in 2004 and 2007. Risks build as Fed rate-hike expectations remain above 70%, while the Dollar Index holds near yearly highs.


Oil, Gold Forecast: Two trades to watch 280926
Oil Rises as U.S.-Iran Peace Hopes Fade. Gold Breaks Down on Hawkish Fed Expectations as Treasury Yields and USD Rise.


Gold Outlook: XAU/USD hit hard as US yields, dollar resume ascent
A stronger dollar, surging front-end yields and renewed geopolitical tension have combined to push gold back towards key technical support.

StoneX Europe Ltd may make third party material available on this website which may contain information included but not limited to the conditions of financial markets. The material is for information purposes only and does not contain, and should not be construed as containing, investment advice and/or investment recommendation and/or an investment research and/or an offer of or solicitation for any transactions in financial instruments; any decision to enter into a specific transaction shall be made by the client following an assessment by him/her of their situation.
StoneX Europe Ltd makes no representation or warranty and assumes no liability as to the accuracy or completeness of the information provided, nor any loss arising from any investment based on a recommendation, forecast or other information supplied. You should always seek independent advice as to your suitability to speculate in any related markets and your ability to assume the associated risks, if you are at all unsure. We are not under any obligation to update any such material. Any opinion made may be personal to the author and may not reflect the opinion of StoneX Europe Ltd.