



How the S&P 500 has historically performed over Thanksgiving
Today we put to the test whether the positive sentiment surrounding Thanksgiving can be seen in their stock market returns.
Share this:

Average returns have been positive for the S&P 500
Using daily data of the S&P 500 (via Refinitiv) we have analysed percentage returns the day before and after Thanksgiving. As the public holiday lands on the fourth Thursday of November each year, it means we’ll look at returns on the Wednesday before and Friday following it.
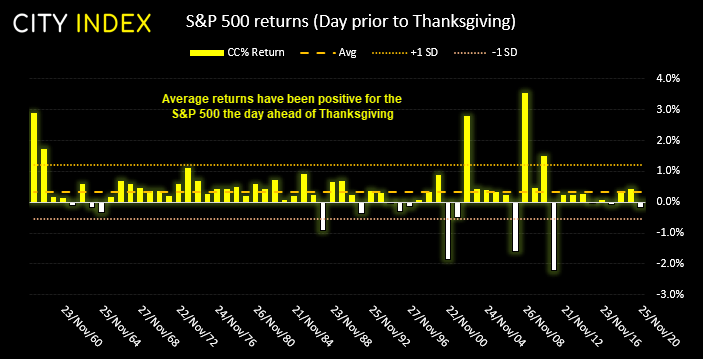

Since 1957, the S&P 500 has produced an average return of 0.34% the day ahead of Thanksgiving. It has also closed higher on 64.5% of the time, with a maximum gain of 3.5% and maximum loss of -2.1%. On the face of it, these numbers look pretty good.
Returns were more consistent on the S&P 500 in earlier years
However, if you look at the chart above you should notice that between 1965 – 1992 the positive relationship was much more apparent, as it only closed lower on 5 sessions over this period. It also posted a positive return on 22 consecutive occasions between 1965 and 1987 (although the 1987 crash may have had something to do with that eventual, pre-Thanksgiving, down-day)
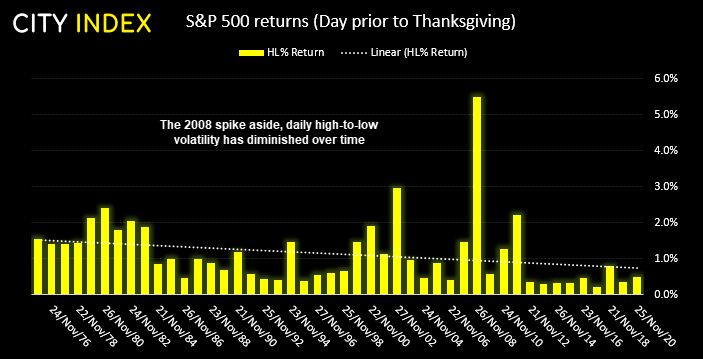
Since 2000, it has posted an average return of 0.23% with a 66% win rate. Therefore, whilst average returns have diminished in recent years it still seems to have a positive expectancy overall. On a side-note, volatility has also diminished in recent years with the trend for the daily high-low volatility sloping lower.
The S&P 500 the day after – party on
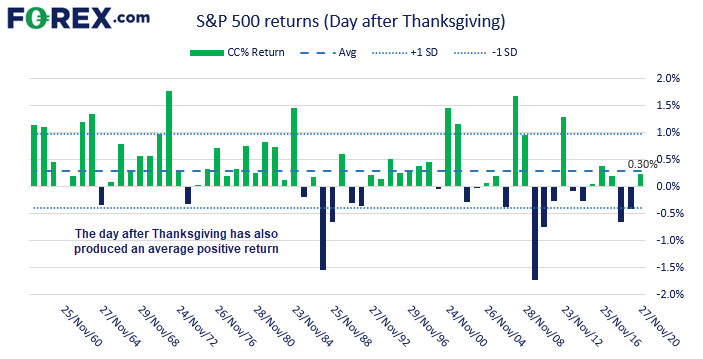
Since 1957, the S&P 500 has posted an average daily return of 0.3% the trading day after Thanksgiving. It has also closed higher 65.2% of the time, although once again positive returns were more apparent between the 60’s and 90’s.

Summary
- S&P 500 has posted positive average returns the day before and after Thanksgiving
- Positive returns were more consistent between the 1960s – 1990s
- Daily volatility on these days have been trending lower over the years
Maybe this time it will be different
Whilst the odds have favoured a positive expectancy overall, it does not provide a roadmap to futures gains. And each new data point is independent from the set it is within. So it’s important to use price action as a guide.
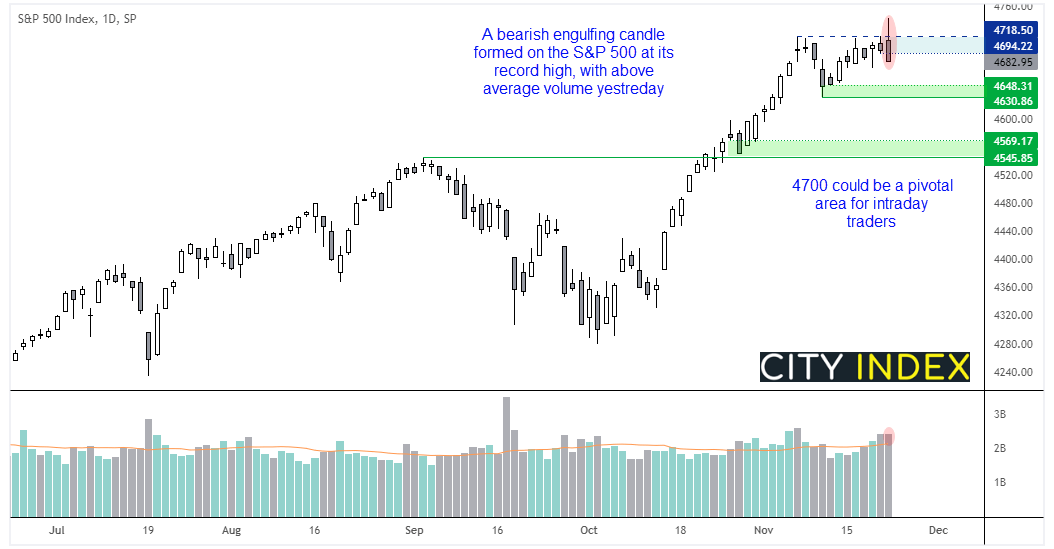
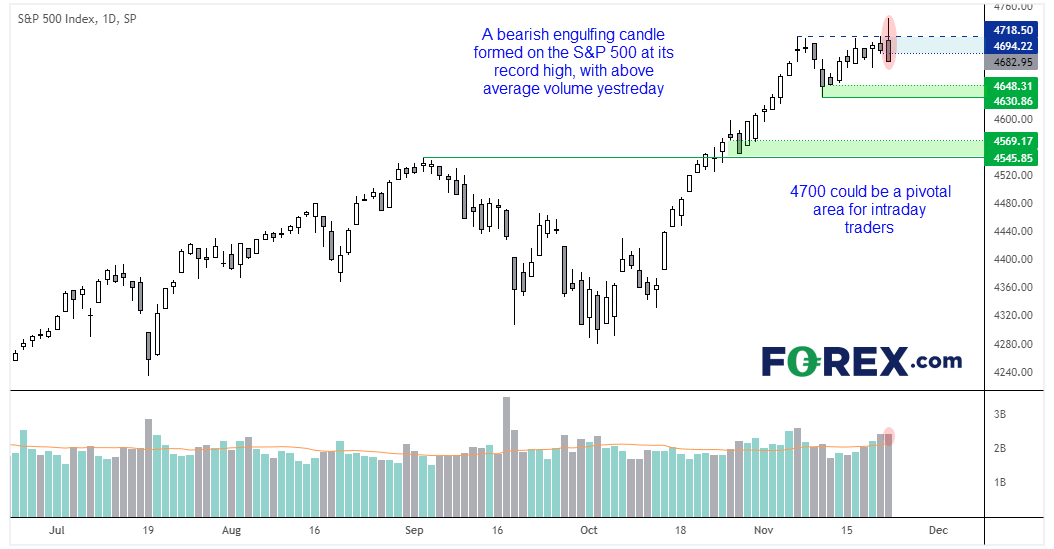
Besides, the S&P 500 printed a bearish engulfing candle on the daily chart yesterday with above-average volume, at its record high. So we go into today’s session with a bearish bias whilst prices remain below the 4700 area, which could be a key focal point for intraday traders today early in the session.
Take note that US stock markets are closed on Thursday for Thanksgiving, and close early on Friday 1pm EST.
How to trade with City Index
You can easily trade with City Index by using these four easy steps:
- Open an account, or log in if you’re already a customer
• Open an account in the UK
• Open an account in Australia
• Open an account in Singapore
- Search for the company you want to trade in our award-winning platform
- Choose your position and size, and your stop and limit levels
- Place the trade
How to trade with FOREX.com
Follow these easy steps to start trading with FOREX.com today:
- Open a Forex.com account, or log in if you’re already a customer.
- Search for the pair you want to trade in our award-winning platform.
- Choose your position and size, and your stop and limit levels.
- Place the trade.
Related tags:


The complete CFD trading experience
Award-winning platforms, competitive spreads, low commissions and dedicated support.
We live and breathe the markets and are dedicated to helping traders realise their ambitions as we continue to set the industry bar.
Economic calendar
Web Trader platform
Our sophisticated web-based platform is packed with features.
Related articles

NZD/USD pressure mounts as payrolls looms large
NZD/USD has fallen sharply as Fed rate expectations reset higher, but extreme downside stretch and major support raise the risk of a violent counter-trend rebound.

US Core PCE Preview: Stale or Significant for the Fed
Core PCE inflation takes center stage Wednesday, with traders watching for signs of renewed price pressure and clues on whether the Fed could hike again in October.

Australian Dollar Forecast: AUD/USD Four-Week Slide Nears Critical Uptrend Support 9 29 2026
Aussie momentum has deteriorated sharply into quarter-end, with inflation, Core PCE and NFP on tap as AUD/USD closes in on a pivotal technical threshold.

StoneX Europe Ltd may make third party material available on this website which may contain information included but not limited to the conditions of financial markets. The material is for information purposes only and does not contain, and should not be construed as containing, investment advice and/or investment recommendation and/or an investment research and/or an offer of or solicitation for any transactions in financial instruments; any decision to enter into a specific transaction shall be made by the client following an assessment by him/her of their situation.
StoneX Europe Ltd makes no representation or warranty and assumes no liability as to the accuracy or completeness of the information provided, nor any loss arising from any investment based on a recommendation, forecast or other information supplied. You should always seek independent advice as to your suitability to speculate in any related markets and your ability to assume the associated risks, if you are at all unsure. We are not under any obligation to update any such material. Any opinion made may be personal to the author and may not reflect the opinion of StoneX Europe Ltd.