



Index in Focus: S&P 500
The S&P 500 has been extremely volatile over the last few weeks, primarily due to rising interest rates and the Russian/Ukraine war.
Share this:

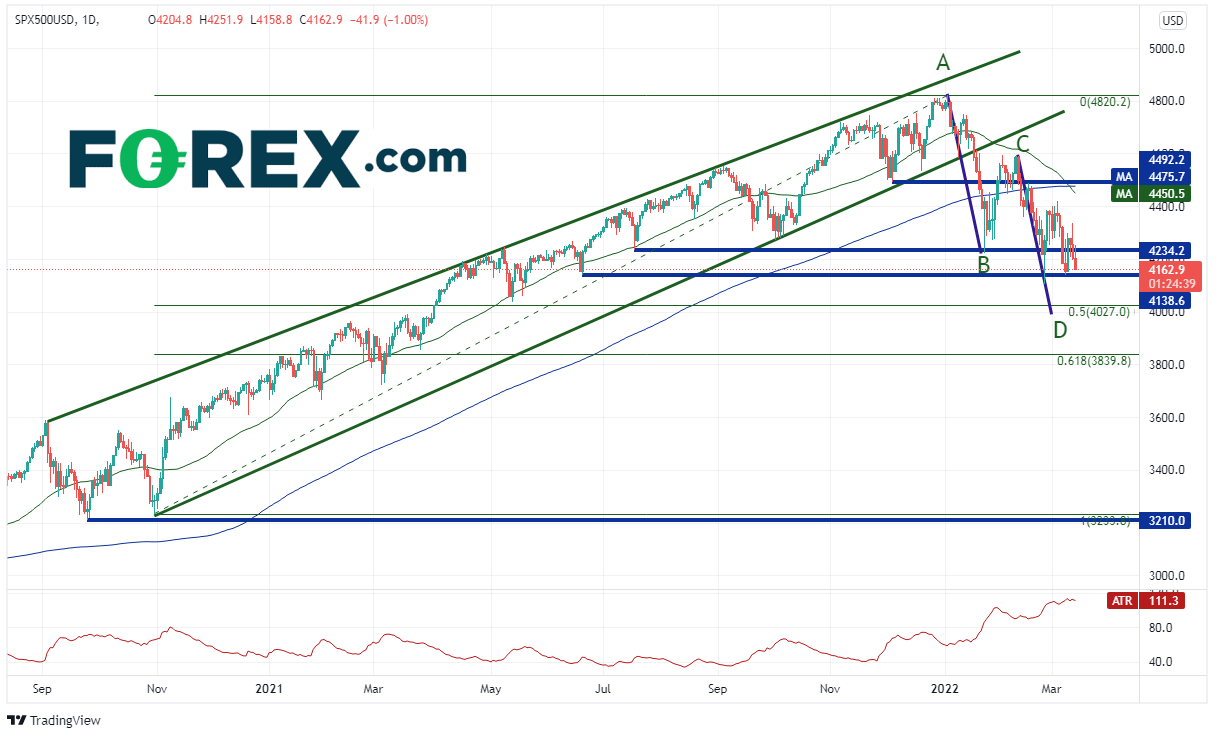
As volatility runs rampant in stocks indices, the S&P 500 has become our most widely traded stock index. The Average True Range for the S&P 500 over the last 14 days is 111 handles, as shown at the bottom of the chart below.
Why has the S&P 500 been so volatile?
- Yields on the 10-year Treasury are at 3-year highs, currently above 2.12%, and rising.Stock markets tend to price in the value of future events. Therefore, the higher interest rates discount the price of future cash flows for companies, helping to push stock prices lower.
- In addition, the FOMC meets on Wednesday, which is sure to add more volatility to the index.See our FOMC Meeting Preview here.A 25bps hike is expected.Traders will also be watching the Summary of Economic Projections (dot plot). This will give traders insight as to what Fed members are thinking in terms of future rate hikes, inflation and growth.Finally, the FOMC may discuss the timing of when the Fed will begin to unwind it balance sheet.The sooner the Fed reduces its bond holdings, the more hawkish the sentiment and presumably the worse it is for stocks.
- The Russian/Ukraine conflict is also weighing on the S&P 500.With every new headline comes market volatility.The latest headlines suggest that talks have been halted until tomorrow and that China has signaled it is willing to provide military support to Russia.With each passing day it seems there are new sanctions placed on Russia, which is driving commodity prices higher and stocks lower.In addition, more and more companies are pulling out of Russia, such as McDonald's, Pepsi, and Starbucks.These bellwether stocks are leaving millions on the table, which is also pushing their stock prices lower.
The S&P 500 index is approaching last week’s lows at 4138.8, which is also horizontal support. Below there is the 50% retracement from lows in the fall of 2020 to the high on January 4th, near 4027. Since the all-time high on January 4th, price has been moving lower in an AB=CD pattern. The target for the pattern is near 4000, which is also psychological round number support. The 61.8% Fibonacci retracement from the same timeframe comes is below there, near 3839.8. Also notice that the 50 Day Moving Average has crossed below the 200 Day Moving Average. This is know as a “Death Cross”, and indicates that that the S&P 500 may continue lower.
Source: Tradingview, Stone X
First resistance is at Friday’s high of 4334.6. Above there is a confluence of resistance at the 50- and 200-Day Moving Averages, and horizontal resistance, between 4450.8 and 4492.2. The next resistance level is at the highs at point C at 4591.4.
The S&P 500 has been extremely volatile over the last few weeks, primarily due to rising interest rates and the Russian/Ukraine war. The FOMC meeting this week should also add volatility to the stock index. Expect the volatility to continue in the near-term.
Learn more about index trading opportunities.
As volatility runs rampant in stocks indices, the S&P 500 has become our most widely traded stock index. The Average True Range for the S&P 500 over the last 14 days is 111 handles, as shown at the bottom of the chart below.
Why has the S&P 500 been so volatile?
- Yields on the 10-year Treasury are at 3-year highs, currently above 2.12%, and rising.Stock markets tend to price in the value of future events. Therefore, the higher interest rates discount the price of future cash flows for companies, helping to push stock prices lower.
- In addition, the FOMC meets on Wednesday, which is sure to add more volatility to the index.See our FOMC Meeting Preview here.A 25bps hike is expected.Traders will also be watching the Summary of Economic Projections (dot plot). This will give traders insight as to what Fed members are thinking in terms of future rate hikes, inflation and growth.Finally, the FOMC may discuss the timing of when the Fed will begin to unwind it balance sheet.The sooner the Fed reduces its bond holdings, the more hawkish the sentiment and presumably the worse it is for stocks.
- The Russian/Ukraine conflict is also weighing on the S&P 500.With every new headline comes market volatility.The latest headlines suggest that talks have been halted until tomorrow and that China has signaled it is willing to provide military support to Russia.With each passing day it seems there are new sanctions placed on Russia, which is driving commodity prices higher and stocks lower.In addition, more and more companies are pulling out of Russia, such as McDonalds, Pepsi, and Starbucks.These bellwether stocks are leaving millions on the table, which is also pushing their stock prices lower.
The S&P 500 index is approaching last week’s lows at 4138.8, which is also horizontal support. Below there is the 50% retracement from lows in the fall of 2020 to the high on January 4th, near 4027. Since the all-time high on January 4th, price has been moving lower in an AB=CD pattern. The target for the pattern is near 4000, which is also psychological round number support. The 61.8% Fibonacci retracement from the same timeframe comes is below there, near 3839.8. Also notice that the 50 Day Moving Average has crossed below the 200 Day Moving Average. This is know as a “Death Cross”, and indicates that that the S&P 500 may continue lower.

Source: Tradingview, Stone X
First resistance is at Friday’s high of 4334.6. Above there is a confluence of resistance at the 50- and 200-Day Moving Averages, and horizontal resistance, between 4450.8 and 4492.2. The next resistance level is at the highs at point C at 4591.4.
The S&P 500 has been extremely volatile over the last few weeks, primarily due to rising interest rates and the Russian/Ukraine war. The FOMC meeting this week should also add volatility to the stock index. Expect the volatility to continue in the near-term.
Learn more about index trading opportunities.
Related tags:
Latest market news




The complete CFD trading experience
Award-winning platforms, competitive spreads, low commissions and dedicated support.
We live and breathe the markets and are dedicated to helping traders realise their ambitions as we continue to set the industry bar.
Economic calendar
Web Trader platform
Our sophisticated web-based platform is packed with features.
Related articles
Gold Q4 2026 outlook: Resilience in the face of rallying dollar and yields
As we headed towards the latter stages of Q3 and into Q4, the Fed had just hiked rates in a hawkish FOMC meeting, while the likes of the ECB and BoJ had also tightened their respective policies. Oil prices remained elevated amid the prolonged US-Iran conflict. Meanwhile, bond yields were breaking out, and the dollar was higher across the board. Yet, remarkably, gold was still holding in the positive territory for the third quarter, even if it had weakened somewhat in September.

Equity Indices Q4, 2026 Outlook: Cracks Begin to Show
There's still an open door for a melt-up in the S&P 500 and Nasdaq but the Dow and Russell 2000 are looking more vulnerable, and until calm hits the Treasuries market there's a higher probability for volatility. The big question is whether that's a next quarter theme or not.

S&P 500 Forecast: SPX rises as oil prices fall, but treasuries remain at multi-decade highs
U.S. stocks are rising on Friday after a volatile week that saw a surge in Treasury yields ripple through financial markets.
StoneX Europe Ltd may make third party material available on this website which may contain information included but not limited to the conditions of financial markets. The material is for information purposes only and does not contain, and should not be construed as containing, investment advice and/or investment recommendation and/or an investment research and/or an offer of or solicitation for any transactions in financial instruments; any decision to enter into a specific transaction shall be made by the client following an assessment by him/her of their situation.
StoneX Europe Ltd makes no representation or warranty and assumes no liability as to the accuracy or completeness of the information provided, nor any loss arising from any investment based on a recommendation, forecast or other information supplied. You should always seek independent advice as to your suitability to speculate in any related markets and your ability to assume the associated risks, if you are at all unsure. We are not under any obligation to update any such material. Any opinion made may be personal to the author and may not reflect the opinion of StoneX Europe Ltd.