



Index in Focus: Dow Jones Industrial Average (DJIA)
Possibly even more important than this week’s FOMC meeting, earnings of firms in the DJIA could provide the next direction for the large cap index.
Share this:

According to Investopedia, the Dow Jones Industrial Average (or simply, the Dow) is a price-weighted index that tracks 30, large, publicly owned companies trading on the NYSE and the NASDAQ. The next direction of the Dow may not hinge as much on the outcome of the FOMC meeting on Wednesday as it will on many of the companies in the large cap index due to release earnings this week. Companies such are 3M, Apple, Boeing, Caterpillar, Chevron, Coca-Cola, Honeywell, Intel, Merck, McDonalds, Microsoft, Proctor and Gamble, and Visa all report earnings this week. The guidance of these firms, including whether these large firms see continued inflation or a recession ahead, have influence over many firms. Therefore, if these firms see lower earnings ahead, many others are likely to as well. But where can the Dow go from here?
On a weekly timeframe, the Dow Jones Industrial Average made a pandemic low in March 2020 near 18214. Like many of the other stock indices, the Dow took off from there as it was apparent the Fed would have an extremely accommodative monetary policy stance during the months ahead as the world went through the Coronavirus pandemic. During the first week of 2022, the Dow made an all-time high at 36952.65, a 100% gain from the pandemic lows. The large cap index then pulled back to the 38.2% Fibonacci retracement level from the pandemic lows to the January highs, near 29653 during the week of June 13th. Since then, price has bounced marginally as it waits for the next catalyst.

Source: Tradingview, Stone X
Trade the Dow now: Login or open a new account!
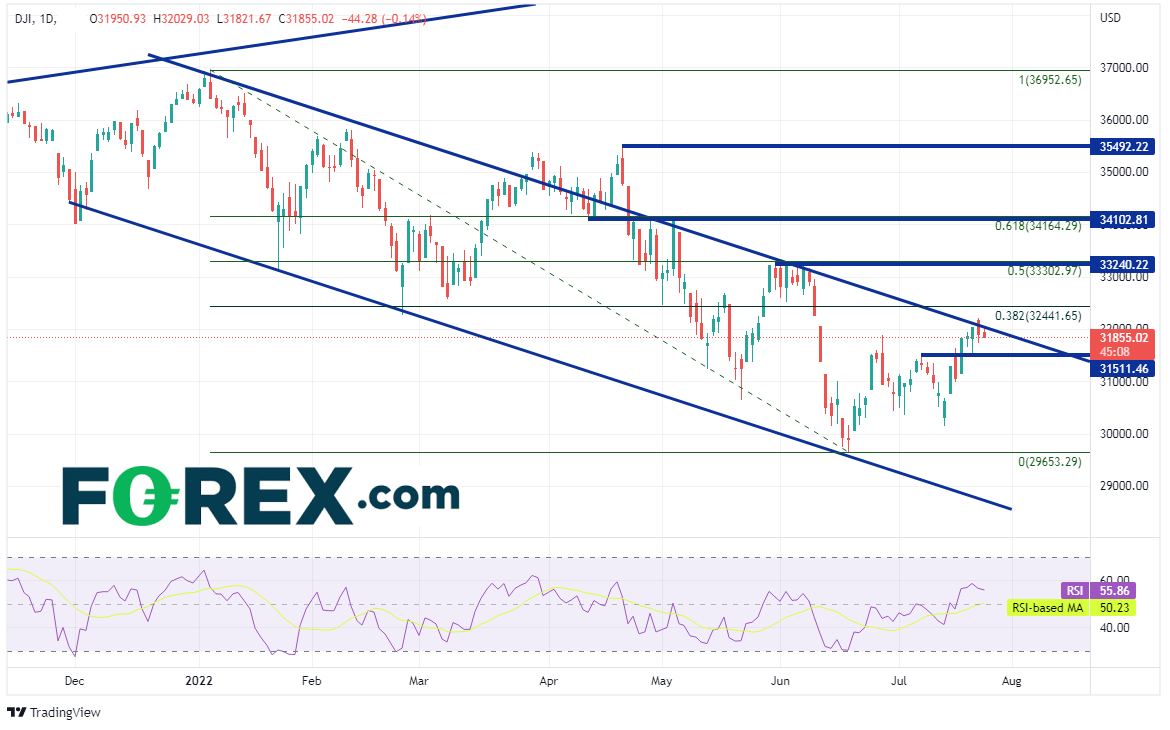
On a daily timeframe, the Dow
pulled back from the all-time highs in an orderly downward sloping channel, twice trying to break above it, once at the end of March and again on April 19th, only to fail and pull back inside both times. Price is currently testing the top trendline once again near 31900. If price moves above the trendline, the first resistance is at the 38.2% Fibonacci retracement from the all-time highs of the June 17th lows near 32442. Above there, is a confluence of horizontal resistance and the 50% retracement level from the same timeframe near 32303/33241. The next resistance is another confluence at the 61.8% Fibonacci retracement and additional horizontal resistance at 34102/34164. However, if the resistance holds, first support is nearby at 31511. Below there, price can fall to the June 17th lows at 29653, and then the bottom trendline of the downward sloping channel, near 28800.
Source: Tradingview, Stone X
Many of the companies in the Dow Jones Industrial Average report earnings this week. Possibly even more important than this week’s FOMC meeting, the earnings of these firms could provide the next direction for the large cap index.
Learn more about index trading opportunities.
According to Investopedia, the Dow Jones Industrial Average (or simply, the Dow) is a price-weighted index that tracks 30, large, publicly owned companies trading on the NYSE and the NASDAQ. The next direction of the Dow may not hinge as much on the outcome of the FOMC meeting on Wednesday as it will on many of the companies in the large cap index due to release earnings this week. Companies such are 3M, Apple, Boeing, Caterpillar, Chevron, Coca-Cola, Honeywell, Intel, Merck, McDonalds, Microsoft, Proctor and Gamble, and Visa all report earnings this week. The guidance of these firms, including whether these large firms see continued inflation or a recession ahead, have influence over many firms. Therefore, if these firms see lower earnings ahead, many others are likely to as well. But where can the Dow go from here?
On a weekly timeframe, the Dow Jones Industrial Average made a pandemic low in March 2020 near 18214. Like many of the other stock indices, the Dow took off from there as it was apparent the Fed would have an extremely accommodative monetary policy stance during the months ahead as the world went through the Coronavirus pandemic. During the first week of 2022, the Dow made an all-time high at 36952.65, a 100% gain from the pandemic lows. The large cap index then pulled back to the 38.2% Fibonacci retracement level from the pandemic lows to the January highs, near 29653 during the week of June 13th. Since then, price has bounced marginally as it waits for the next catalyst.

Source: Tradingview, Stone X
Trade the Dow now: Login or Open a new account!
• Open an account in the UK
• Open an account in Australia
• Open an account in Singapore
On a daily timeframe, the Dow
pulled back from the all-time highs in an orderly downward sloping channel, twice trying to break above it, once at the end of March and again on April 19th, only to fail and pull back inside both times. Price is currently testing the top trendline once again near 31900. If price moves above the trendline, the first resistance is at the 38.2% Fibonacci retracement from the all-time highs of the June 17th lows near 32442. Above there, is a confluence of horizontal resistance and the 50% retracement level from the same timeframe near 32303/33241. The next resistance is another confluence at the 61.8% Fibonacci retracement and additional horizontal resistance at 34102/34164. However, if the resistance holds, first support is nearby at 31511. Below there, price can fall to the June 17th lows at 29653, and then the bottom trendline of the downward sloping channel, near 28800.

Source: Tradingview, Stone X
Many of the companies in the Dow Jones Industrial Average report earnings this week. Possibly even more important than this week’s FOMC meeting, the earnings of these firms could provide the next direction for the large cap index.
Related tags:
Latest market news



The complete CFD trading experience
Award-winning platforms, competitive spreads, low commissions and dedicated support.
We live and breathe the markets and are dedicated to helping traders realise their ambitions as we continue to set the industry bar.
Economic calendar
Web Trader platform
Our sophisticated web-based platform is packed with features.
Related articles
Gold Q4 2026 outlook: Resilience in the face of rallying dollar and yields
As we headed towards the latter stages of Q3 and into Q4, the Fed had just hiked rates in a hawkish FOMC meeting, while the likes of the ECB and BoJ had also tightened their respective policies. Oil prices remained elevated amid the prolonged US-Iran conflict. Meanwhile, bond yields were breaking out, and the dollar was higher across the board. Yet, remarkably, gold was still holding in the positive territory for the third quarter, even if it had weakened somewhat in September.


Equity Indices Q4, 2026 Outlook: Cracks Begin to Show
There's still an open door for a melt-up in the S&P 500 and Nasdaq but the Dow and Russell 2000 are looking more vulnerable, and until calm hits the Treasuries market there's a higher probability for volatility. The big question is whether that's a next quarter theme or not.

Oil Quietly Hands the Fed a Reason to Stay Hawkish
Oil prices and the U.S. dollar are both on the front foot as elevated energy costs feed Fed warnings that inflation may prove sticky.
StoneX Europe Ltd may make third party material available on this website which may contain information included but not limited to the conditions of financial markets. The material is for information purposes only and does not contain, and should not be construed as containing, investment advice and/or investment recommendation and/or an investment research and/or an offer of or solicitation for any transactions in financial instruments; any decision to enter into a specific transaction shall be made by the client following an assessment by him/her of their situation.
StoneX Europe Ltd makes no representation or warranty and assumes no liability as to the accuracy or completeness of the information provided, nor any loss arising from any investment based on a recommendation, forecast or other information supplied. You should always seek independent advice as to your suitability to speculate in any related markets and your ability to assume the associated risks, if you are at all unsure. We are not under any obligation to update any such material. Any opinion made may be personal to the author and may not reflect the opinion of StoneX Europe Ltd.