



Index in Focus: S&P 500
Worse than expected economic data, continued high inflation, lower retail earnings, and a hawkish Fed are all reasons to expect that the S&P 500 Index may head lower.
Share this:

Durable goods Orders for April released today came in a 0.4% MoM vs an expectation of 0.6% MoM and a March reading of 0.6% MoM. Durable Goods Orders Ex-Transportation was 0.3% MoM vs 0.6% MoM expected and 1.2% MoM in March. Across the board, economic data in the US has been worse than expected. This includes PMI data, housing data, and Consumer Sentiment data. In addition, large retailers such as Walmart and Target missed earnings estimate and guided forecasts lower due to supply chain issues and higher costs. Yet Fed Chairman Powell and the rest of the FOMC are in the process of raising interest rates. Based on current comments from Fed members, it seems like they are trying to guide to markets to expect a 50bps hike at the June and July meetings, which would bring the Fed Funds rate to 2%. The April CPI reading was 8.3% YoY. We have a picture now of slowing growth, higher inflation, and a hawkish Fed. The only data that has been good as of late is the employment data, however Fed Chairman Powell said recently that getting inflation down may come at the expense of the 3.6% unemployment rate. By the way, as a reminder the first look at Q1 2022 GDP was -1.4%.
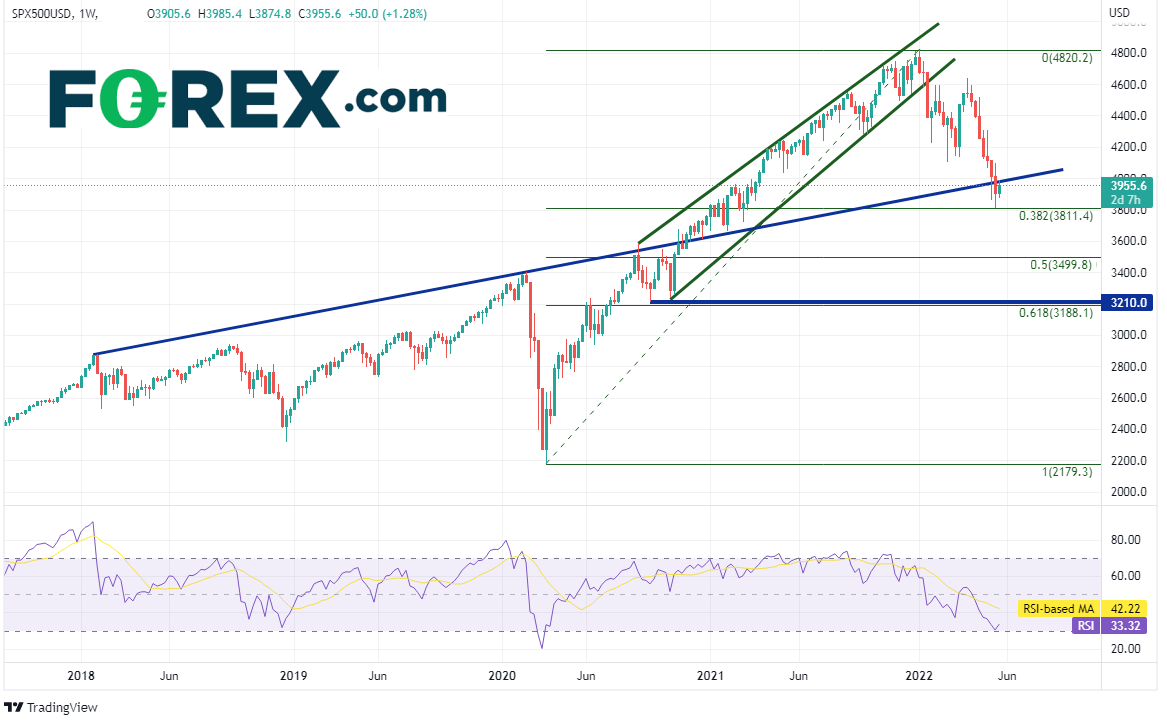
As a result of the above scenario, the S&P 500 Index has been moving lower. On a weekly timeframe, price made a new all-time high of 4820.2 during the first week of 2022 and has been moving lower since. The index is down nearly 18% from the all-time high. The large cap index had been trading in a rising wedge formation since September 2020 but broke aggressively lower, below the bottom trendline of the wedge, during the week of January 17th. The target for the break of a rising wedge is a 100% retracement of the wedge, or near 3210. However, thus far, price has pulled back to (and held) the 38.2% Fibonacci retracement level from the pandemic lows in March 2020 to the recent all-time highs, at 3811.4. In doing so, the S&P 500 has also broken below a long-term rising trendline, dating to January 2018, near 3980.
Source: Tradingview, Stone X
Trade the S&P 500 now: Login or open a new account!
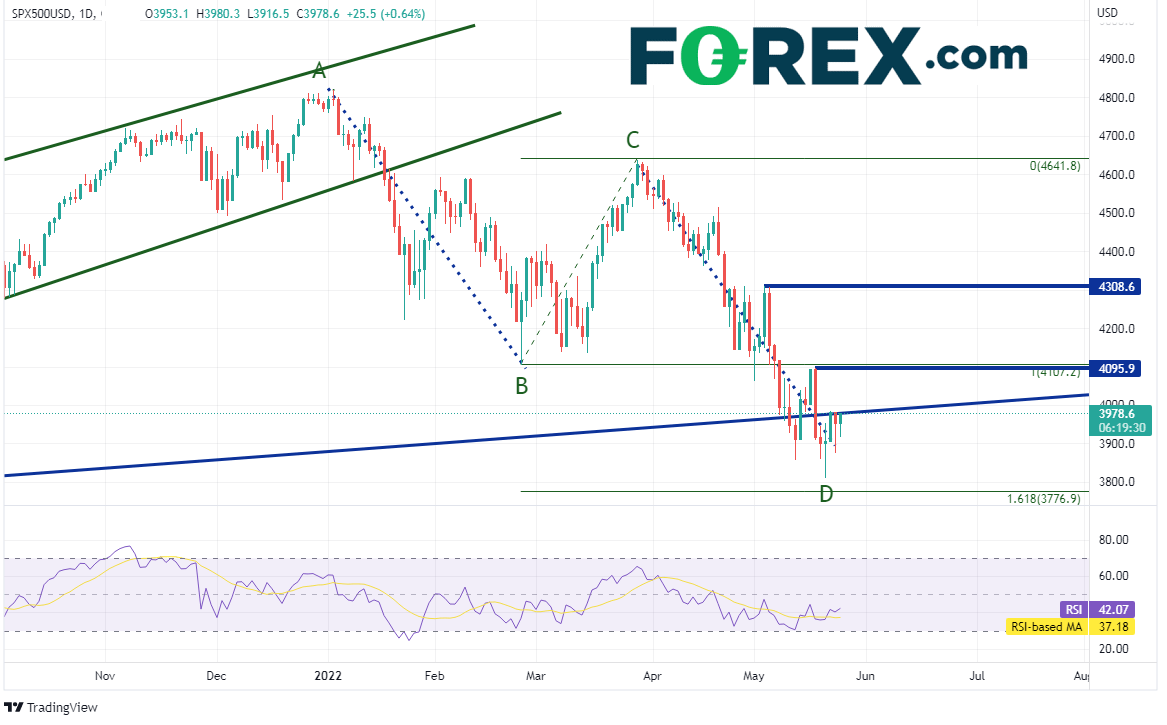
On a daily timeframe, the S&P 500 Index has completed an AB=CD pattern off the all-time highs. In addition, thus far, price has held above support at the 161.8% Fibonacci extension from the low of February 24th to the highs of March 29th at 3776.9. If price breaks below, they next levels of support are the 50% retracement level and the 61.8% Fibonacci retracement level on the weekly timeframe at 3500 and 3188.1, respectively. However, if the near-term support levels holds (3811 on weekly and 3776.9 on daily) and price does bounce, there is strong horizontal resistance between 4096 and 4107. Above there, price can move to horizontal resistance at 4308.6.
Source: Tradingview, Stone X
Worse than expected economic data, continued high inflation, lower retail earnings, and a hawkish Fed are all reasons to expect that the S&P 500 Index may head lower. However, given that the index is already down 18% from its January highs and at several support levels, one has to consider that a near-term bounce may be ahead!
Learn more about index trading opportunities.
Durable goods Orders for April released today came in a 0.4% MoM vs an expectation of 0.6% MoM and a March reading of 0.6% MoM. Durable Goods Orders Ex-Transportation was 0.3% MoM vs 0.6% MoM expected and 1.2% MoM in March. Across the board, economic data in the US has been worse than expected. This includes PMI data, housing data, and Consumer Sentiment data. In addition, large retailers such as Walmart and Target missed earnings estimate and guided forecasts lower due to supply chain issues and higher costs. Yet Fed Chairman Powell and the rest of the FOMC are in the process of raising interest rates. Based on current comments from Fed members, it seems like they are trying to guide to markets to expect a 50bps hike at the June and July meetings, which would bring the Fed Funds rate to 2%. The April CPI reading was 8.3% YoY. We have a picture now of slowing growth, higher inflation, and a hawkish Fed. The only data that has been good as of late is the employment data, however Fed Chairman Powell said recently that getting inflation down may come at the expense of the 3.6% unemployment rate. By the way, as a reminder the first look at Q1 2022 GDP was -1.4%.
As a result of the above scenario, the S&P 500 Index has been moving lower. On a weekly timeframe, price made a new all-time high of 4820.2 during the first week of 2022 and has been moving lower since. The index is down nearly 18% from the all-time high. The large cap index had been trading in a rising wedge formation since September 2020 but broke aggressively lower, below the bottom trendline of the wedge, during the week of January 17th. The target for the break of a rising wedge is a 100% retracement of the wedge, or near 3210. However, thus far, price has pulled back to (and held) the 38.2% Fibonacci retracement level from the pandemic lows in March 2020 to the recent all-time highs, at 3811.4. In doing so, the S&P 500 has also broken below a long-term rising trendline, dating to January 2018, near 3980.

Source: Tradingview, Stone X
Trade the S&P 500 now: Login or Open a new account!
• Open an account in the UK
• Open an account in Australia
• Open an account in Singapore
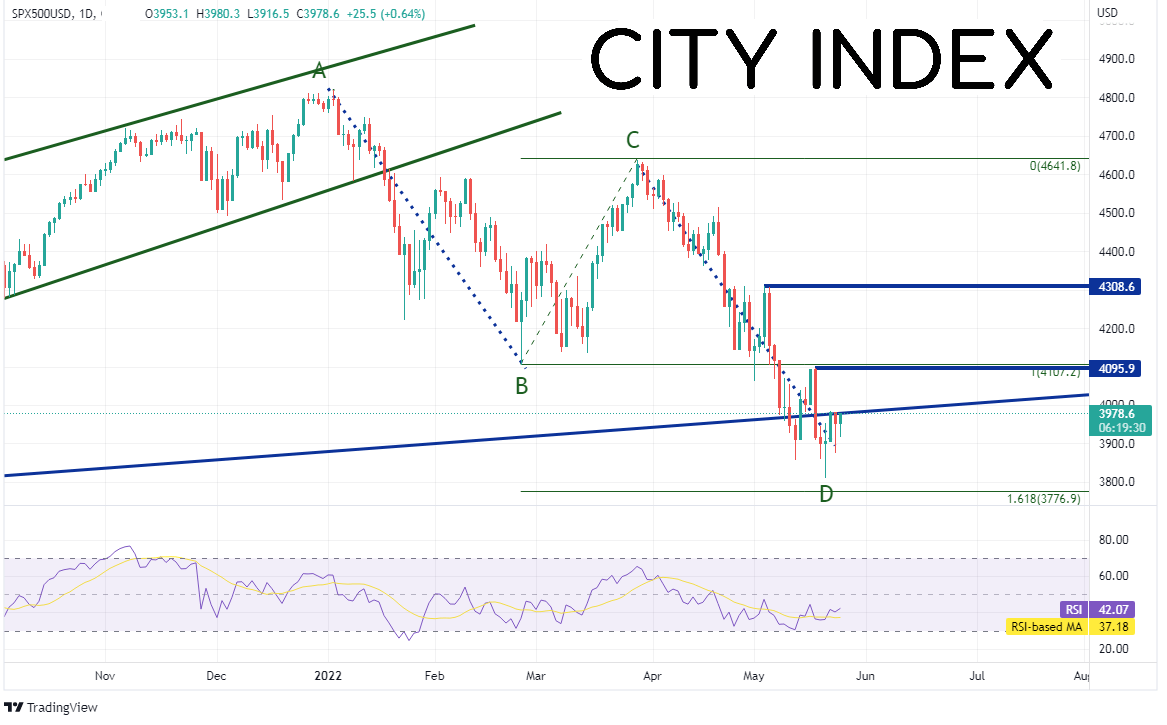
On a daily timeframe, the S&P 500 Index has completed an AB=CD pattern off the all-time highs. In addition, thus far, price has held above support at the 161.8% Fibonacci extension from the low of February 24th to the highs of March 29th at 3776.9. If price breaks below, they next levels of support are the 50% retracement level and the 61.8% Fibonacci retracement level on the weekly timeframe at 3500 and 3188.1, respectively. However, if the near-term support levels holds (3811 on weekly and 3776.9 on daily) and price does bounce, there is strong horizontal resistance between 4096 and 4107. Above there, price can move to horizontal resistance at 4308.6.
Source: Tradingview, Stone X
Worse than expected economic data, continued high inflation, lower retail earnings, and a hawkish Fed are all reasons to expect that the S&P 500 Index may head lower. However, given that the index is already down 18% from its January highs and at several support levels, one has to consider that a near-term bounce may be ahead!
Learn more about index trading opportunities.
Related tags:



The complete CFD trading experience
Award-winning platforms, competitive spreads, low commissions and dedicated support.
We live and breathe the markets and are dedicated to helping traders realise their ambitions as we continue to set the industry bar.
Economic calendar
Web Trader platform
Our sophisticated web-based platform is packed with features.
Related articles
Gold forecast: XAU/USD could take a larger dive after the big rise in yields
Gold prices have been falling in the last few days after last week’s post-FOMC pop faded amid rising interest rate expectations, higher oil prices and a strengthening US dollar. As before, I wasn’t convinced gold would thrive in the current macro backdrop.

Gold, silver slammed as hawkish Fed repricing reignites dollar upside
Gold and silver had held up surprisingly well against surging US yields. Wednesday’s DXY breakout may have changed that equation.


Euro Short-term Outlook: EUR/USD Selloff Nears Critical Yearly Support 9 23 2026
Euro has fallen seven of the past nine sessions, with stretched momentum raising the stakes as EUR/USD closes in on a major inflection zone.

StoneX Europe Ltd may make third party material available on this website which may contain information included but not limited to the conditions of financial markets. The material is for information purposes only and does not contain, and should not be construed as containing, investment advice and/or investment recommendation and/or an investment research and/or an offer of or solicitation for any transactions in financial instruments; any decision to enter into a specific transaction shall be made by the client following an assessment by him/her of their situation.
StoneX Europe Ltd makes no representation or warranty and assumes no liability as to the accuracy or completeness of the information provided, nor any loss arising from any investment based on a recommendation, forecast or other information supplied. You should always seek independent advice as to your suitability to speculate in any related markets and your ability to assume the associated risks, if you are at all unsure. We are not under any obligation to update any such material. Any opinion made may be personal to the author and may not reflect the opinion of StoneX Europe Ltd.