



Nasdaq 100 analysis: NDX surges to a 30% YTD gain – where next?
At this point, it feels inevitable that “The Great AI Boom of 2023” will become “The Great AI Bubble of 2023,” if it hasn’t already...
Share this:

Nasdaq 100 takeaways
- The Nasdaq 100 has now surged by more than 5% in less than two days after Nvidia’s stellar earnings in another sign of a potential AI bubble in the making.
- Positive signs around a potential debt ceiling deal and resilience in the US economy are also supporting the index.
- The next resistance level to watch is 14,355, the 61.8% Fibonacci retracement of the bear market
Nasdaq 100 fundamental analysis
Wednesday’s earnings from chipmaking giant Nvidia have provided a shot of adrenaline for risk appetite, and the Nasdaq 100 has been by far the biggest beneficiary.
At this point, it feels inevitable that “The Great AI Boom of 2023” will become “The Great AI Bubble of 2023,” if it hasn’t already, but that doesn’t mean that enthusiasm (and prices) can’t go much higher in the interim. As billionaire investor George Soros famously quipped, “When I see a bubble forming, I rush in to buy, adding fuel to the fire.”
It’s clear from this quarter’s earnings conference calls that many companies have the same idea:
Source: Bank of America
Of course, the risk with hopping on such an obvious trend is being the “greatest fool,” or the last one to buy right at the top, but with continued positivity around a potential debt ceiling deal and this morning’s Core PCE report showing a more resilient US economy than expected, there are other fundamental storylines supporting today’s rally in the Nasdaq 100.
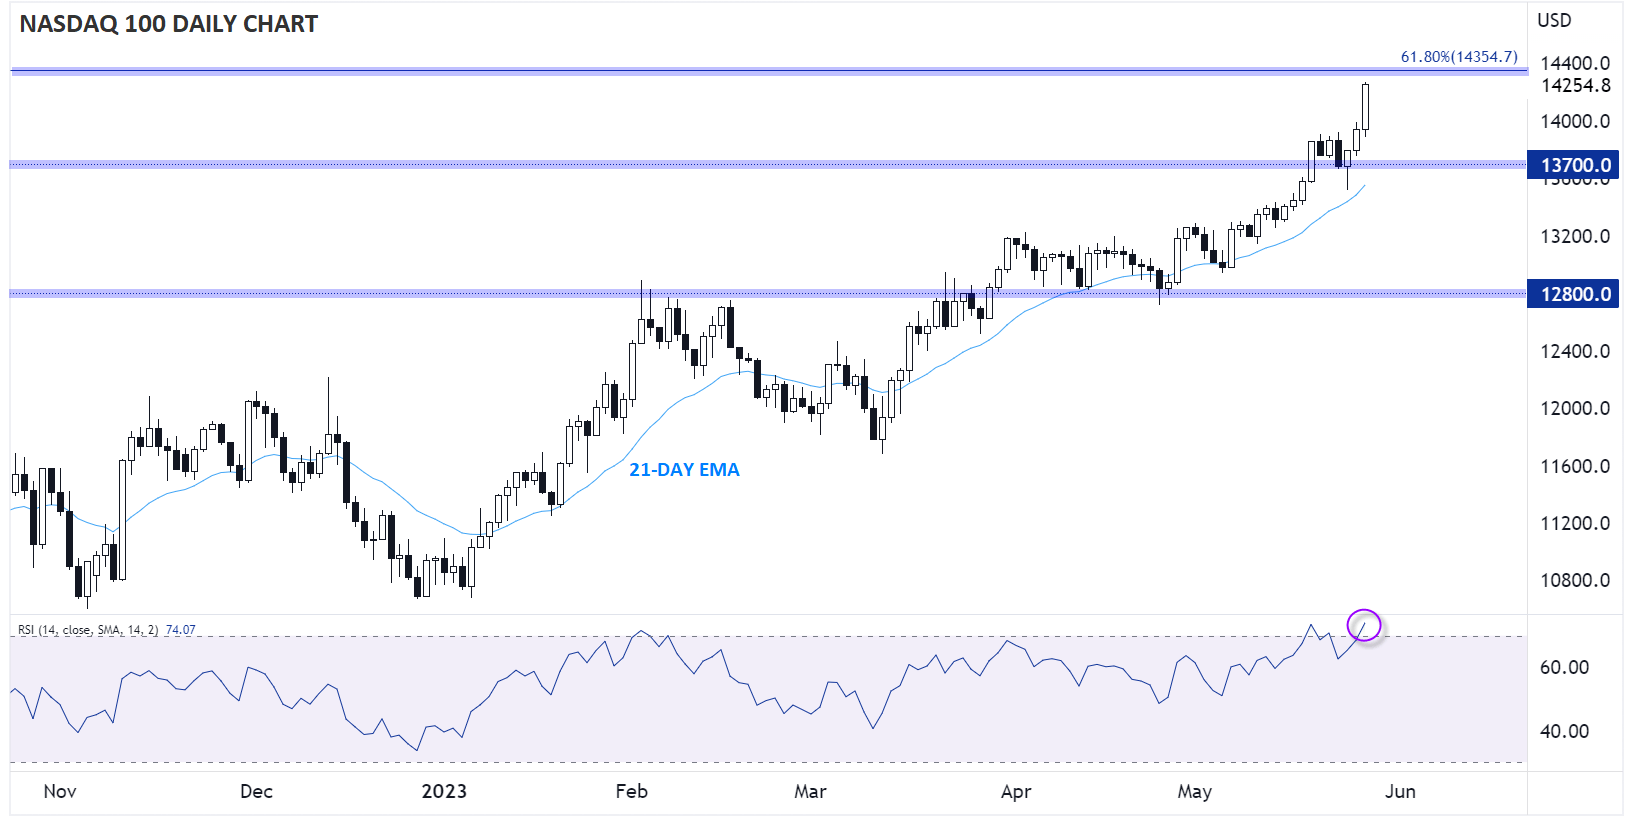
Nasdaq 100 technical analysis – NDX daily chart
Since Nvidia’s earnings after the bell on Wednesday, the Nasdaq 100 has rallied by more than 5% in less than two days, bringing the year-to-date return for the tech-heavy index to more than 30%.
Looking at the chart, the situation is relatively clear: The Nasdaq 100 remains in a strong uptrend, though prices are undoubtedly overbought in the short term, raising the risk of a pullback next week. If the short-term rally continues, the next notable resistance level to watch is the 61.8% Fibonacci retracement of the recent bear market near 14,355, with room up to the Q1 2022 highs above 15,000 if bulls can clear that hurdle.
Source: Tradingview, StoneX
Meanwhile, more conservative traders may prefer to wait for a pullback toward 14,000 next week to join the uptrend at a potentially more favorable price. Only a confirmed close back below previous-resistance-turned-support at 13,700 would erase the near-term bullish bias.
-- Written by Matt Weller, Global Head of Research
Follow Matt on Twitter: @MWellerFX
Related tags:
Latest market news




The complete CFD trading experience
Award-winning platforms, competitive spreads, low commissions and dedicated support.
We live and breathe the markets and are dedicated to helping traders realise their ambitions as we continue to set the industry bar.
Economic calendar
Web Trader platform
Our sophisticated web-based platform is packed with features.
Related articles
US Core PCE Preview: Stale or Significant for the Fed
Core PCE inflation takes center stage Wednesday, with traders watching for signs of renewed price pressure and clues on whether the Fed could hike again in October.
Australian Dollar Forecast: AUD/USD Four-Week Slide Nears Critical Uptrend Support 9 29 2026
Aussie momentum has deteriorated sharply into quarter-end, with inflation, Core PCE and NFP on tap as AUD/USD closes in on a pivotal technical threshold.


Canadian Dollar Technical Outlook: USD/CAD Seven-Day Rally Tests Major Resistance 9 29 2026
USD/CAD is pressing into a major technical barrier after an extended advance, raising the risk for price inflection as momentum stretches.
StoneX Europe Ltd may make third party material available on this website which may contain information included but not limited to the conditions of financial markets. The material is for information purposes only and does not contain, and should not be construed as containing, investment advice and/or investment recommendation and/or an investment research and/or an offer of or solicitation for any transactions in financial instruments; any decision to enter into a specific transaction shall be made by the client following an assessment by him/her of their situation.
StoneX Europe Ltd makes no representation or warranty and assumes no liability as to the accuracy or completeness of the information provided, nor any loss arising from any investment based on a recommendation, forecast or other information supplied. You should always seek independent advice as to your suitability to speculate in any related markets and your ability to assume the associated risks, if you are at all unsure. We are not under any obligation to update any such material. Any opinion made may be personal to the author and may not reflect the opinion of StoneX Europe Ltd.