



Nikkei 225 Index Expect to Challenge 2018 High
Japan's Nikkei 225 Index rebounded around 40% from March low. Currently, the Index remains holding on the upside and expects to challenge the high of 2018.
Share this:

Japan's Nikkei 225 Index rebounded around 40% from March low. Currently, the Index remains holding on the upside and expects to challenge the high of 2018.
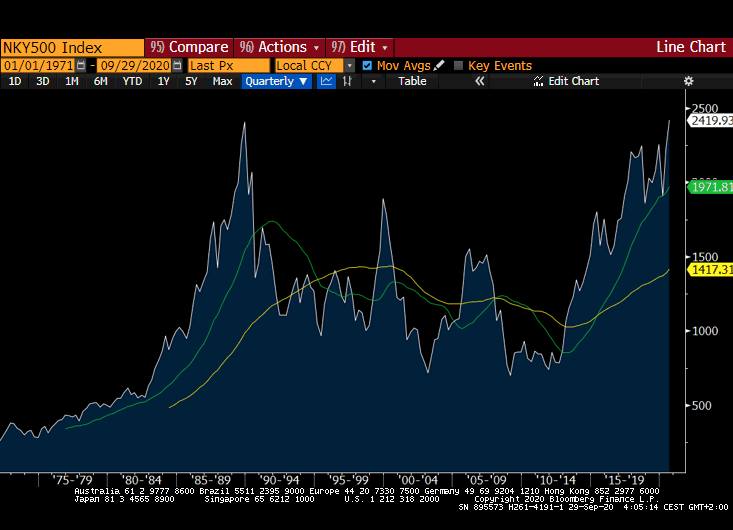
In fact, the Nikkei 500 Index, a lesser-known index in Japan, already broke above its historical high level, which recorded in 1989. The Nikkei 500 Index contains more technology and services companies to reflect current Japan's economy, but the lagged behind Nikkei 225 Index includes a lot of old economy firms.

Source: Bloomberg
On the economic front, Japan's Tokyo CPI grew 0.2% on year in September (+0.1% expected), according to the government. However, the CPI still stays at a slower growth pace, which suggests that Japan's economy still needs more stimulus to leave the stagflation in the loss of 20 years. In addition, retail sales dropped 1.9% on year in August (-1.9% expected) and industrial production decreased 13.3%.
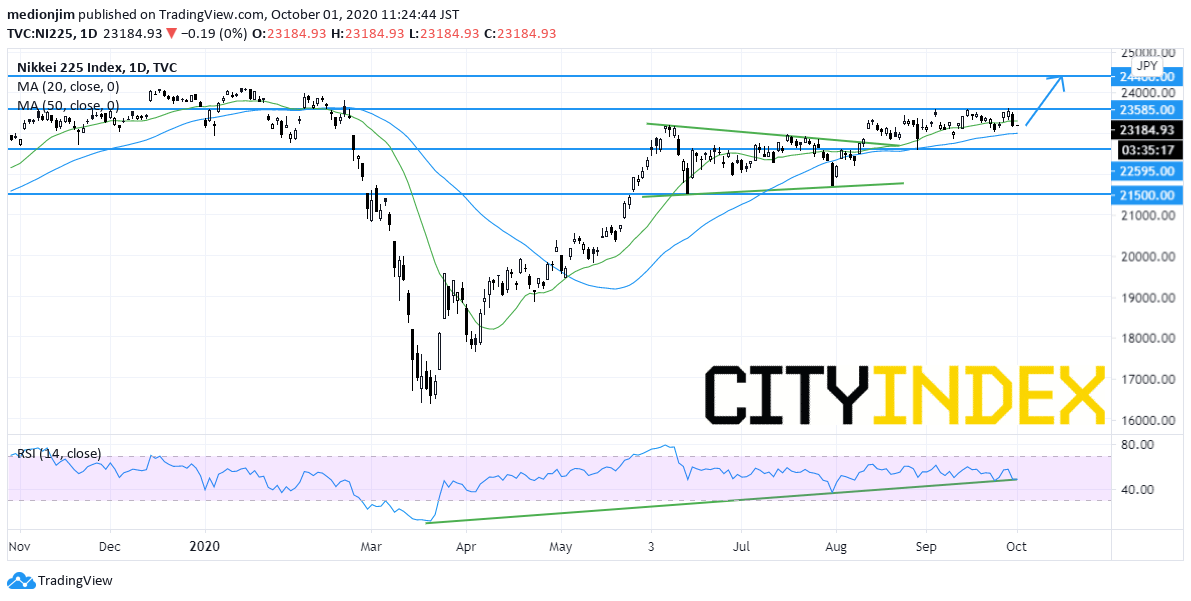
From a technical point of view, the Nikkei 225 Index is holding on the upside after breaking above the symmetric triangle pattern. Currently, the index prices are trading above both rising 20-day and 50-day moving averages. The relative strength index is supported by a rising trend line
Hence, bullish readers could set the nearest support level at 22595, while resistance levels would be located at 23585 (the previous high) and 24400 (the high of 2018).
Source: GAIN Capital, TradingView
In fact, the Nikkei 500 Index, a lesser-known index in Japan, already broke above its historical high level, which recorded in 1989. The Nikkei 500 Index contains more technology and services companies to reflect current Japan's economy, but the lagged behind Nikkei 225 Index includes a lot of old economy firms.
Source: Bloomberg
On the economic front, Japan's Tokyo CPI grew 0.2% on year in September (+0.1% expected), according to the government. However, the CPI still stays at a slower growth pace, which suggests that Japan's economy still needs more stimulus to leave the stagflation in the loss of 20 years. In addition, retail sales dropped 1.9% on year in August (-1.9% expected) and industrial production decreased 13.3%.
From a technical point of view, the Nikkei 225 Index is holding on the upside after breaking above the symmetric triangle pattern. Currently, the index prices are trading above both rising 20-day and 50-day moving averages. The relative strength index is supported by a rising trend line
Hence, bullish readers could set the nearest support level at 22595, while resistance levels would be located at 23585 (the previous high) and 24400 (the high of 2018).
Source: GAIN Capital, TradingView
Japan's Nikkei 225 Index rebounded around 40% from March low. Currently, the Index remains holding on the upside and expects to challenge the high of 2018.
In fact, the Nikkei 500 Index, a lesser-known index in Japan, already broke above its historical high level, which recorded in 1989. The Nikkei 500 Index contains more technology and services companies to reflect current Japan's economy, but the lagged behind Nikkei 225 Index includes a lot of old economy firms.
Source: Bloomberg
On the economic front, Japan's Tokyo CPI grew 0.2% on year in September (+0.1% expected), according to the government. However, the CPI still stays at a slower growth pace, which suggests that Japan's economy still needs more stimulus to leave the stagflation in the loss of 20 years. In addition, retail sales dropped 1.9% on year in August (-1.9% expected) and industrial production decreased 13.3%.
From a technical point of view, the Nikkei 225 Index is holding on the upside after breaking above the symmetric triangle pattern. Currently, the index prices are trading above both rising 20-day and 50-day moving averages. The relative strength index is supported by a rising trend line
Hence, bullish readers could set the nearest support level at 22595, while resistance levels would be located at 23585 (the previous high) and 24400 (the high of 2018).

Source: GAIN Capital, TradingView
In fact, the Nikkei 500 Index, a lesser-known index in Japan, already broke above its historical high level, which recorded in 1989. The Nikkei 500 Index contains more technology and services companies to reflect current Japan's economy, but the lagged behind Nikkei 225 Index includes a lot of old economy firms.
Source: Bloomberg
On the economic front, Japan's Tokyo CPI grew 0.2% on year in September (+0.1% expected), according to the government. However, the CPI still stays at a slower growth pace, which suggests that Japan's economy still needs more stimulus to leave the stagflation in the loss of 20 years. In addition, retail sales dropped 1.9% on year in August (-1.9% expected) and industrial production decreased 13.3%.
From a technical point of view, the Nikkei 225 Index is holding on the upside after breaking above the symmetric triangle pattern. Currently, the index prices are trading above both rising 20-day and 50-day moving averages. The relative strength index is supported by a rising trend line
Hence, bullish readers could set the nearest support level at 22595, while resistance levels would be located at 23585 (the previous high) and 24400 (the high of 2018).
Source: GAIN Capital, TradingView
Latest market news




The complete CFD trading experience
Award-winning platforms, competitive spreads, low commissions and dedicated support.
We live and breathe the markets and are dedicated to helping traders realise their ambitions as we continue to set the industry bar.
Economic calendar
Web Trader platform
Our sophisticated web-based platform is packed with features.
Related articles

S&P 500 forecast: Stocks extend drop as correction risks grow
US and global equity markets have extended Wednesday’s sell-off, with Wall Street opening lower after a weak handover from Asia and Europe. The deterioration in risk appetite has been spreading across global markets. The dollar was firmer, Treasury yields were holding onto yesterday’s gains, while gold, silver and bitcoin were all under pressure alongside equities and major currencies.

Nikkei threatens breakout as tech rebound broadens
Breakouts across the SOX and Nasdaq are being matched by rebounds across Asia, with the Nikkei now threatening to join the move.


Nasdaq 100 Forecast: Confidence Returns as the Index Challenges Record Highs
The trading week is getting underway with renewed bullish momentum across Nasdaq. This is reflected in today's session, where the index has gained more than 2.5%, highlighting a buying bias that has not been observed with this level of strength in several weeks.

StoneX Europe Ltd may make third party material available on this website which may contain information included but not limited to the conditions of financial markets. The material is for information purposes only and does not contain, and should not be construed as containing, investment advice and/or investment recommendation and/or an investment research and/or an offer of or solicitation for any transactions in financial instruments; any decision to enter into a specific transaction shall be made by the client following an assessment by him/her of their situation.
StoneX Europe Ltd makes no representation or warranty and assumes no liability as to the accuracy or completeness of the information provided, nor any loss arising from any investment based on a recommendation, forecast or other information supplied. You should always seek independent advice as to your suitability to speculate in any related markets and your ability to assume the associated risks, if you are at all unsure. We are not under any obligation to update any such material. Any opinion made may be personal to the author and may not reflect the opinion of StoneX Europe Ltd.