



OK Fed followers: When is a pivot, not a pivot?
Jerome Powell hit the wires and effectively confirmed that the Fed will slow their pace of tightening, reigniting the argument over what a ‘pivot’ is.
Share this:

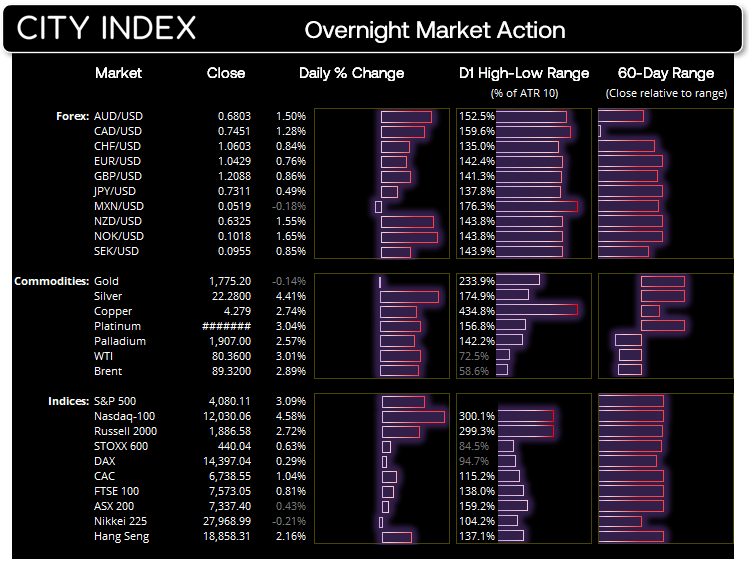
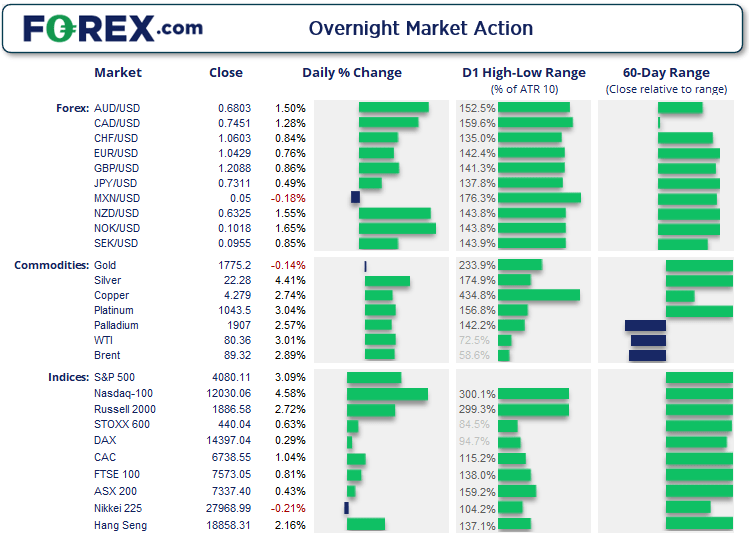
Jerome Powell effectively confirmed that the Fed will slow their pace of tightening, prompting strong correlations among asset classes which sent the dollar and yields lower, equities, commodities and (of course) commodity FX higher. Strong, highly correlated reactions signify important events as investors have likely been forced out of an incorrect trade, switched positions or added to their previous convictions.
And make no mistake, Jerome’s speech was an important event; if the Fed are deemed to be slowing their tightening pace, it is then assumed they are closer to pausing and eventually reversing hikes (policy blunders out with).
In turn, this has seen headlines of the famous ‘Fed pivot’ return, alongside fierce social media debates over its very definition.
Monetary policy and pivots:
When it comes to monetary policy, the definition ‘pivot’ has become obscured. Personally, I view a pivot as the point in which a direction is reversed. If I am driving north but want to head south, a pivot is the point in which the reversal of direction occurs. Using this definition for a monetary policy pivot, it would assume a Fed pivot is when they signal they are to begin cutting rates, after a series of hikes.
Yet the media feedback loop seems to have obscured this classic definition, prompting many to call a Fed pivot – despite them also saying rates will continue to rise. Using this definition is saying a pivot is a change of momentum, not direction. To use the car analogy, a person is driving north and slows down for a bump in the road – and the point of deceleration is deemed to be the pivot.
Direction vs speed
You can argue that it doesn’t really matter, supposing one plans the trade and trades the plan. But understanding that the debate is really about whether we are measuring the change of direction verses change of momentum can quickly help you understand which ‘group’ of pivot speakers you are dealing with, and decide for yourself which is the more significant.
But the fact we saw a strong reaction in US markets which has seen little follow-through in the Asian session suggests some are already question how much of a ‘pivot’ that really was. Besides, we also have the Nonfarm payrolls report tomorrow which can also suppress volatility ahead of it.
Now and Next for the Fed
Debates aside, what most agree on is that the Fed will continue to hike rates but at a slower speed. So it will be a case of deciphering how high they will go and how long they will remain elevated.
- Fed fund futures currently estimate a 75.8% probability of a 50bp hike in December (from 4.0% to 4.5%)
- They also assume rates to peak at 5.25% in June
- However, the June peak is only a 37.3% probability so markets lack some conviction this far out
- In September, the Fed’s median view was for rates to peak at 4.6% by the end of 2023 and fall back to 3.9% by the end of 2024.
- It is worth noting that Powell said the terminal rate would likely be “somewhat higher than 4.6%”, so the Dot plot could be upgraded in their December meeting
- Powell warned that rates would need to be held at a “restrictive level for some time” (higher rates for longer)
- With Powell warning of higher rates for longer, the money markets estimate of a peak in June may be misplaced
- The Fed next meets on December 14th then return on February the 1st.
- CPI data is released 1-day ahead of the next Fed meeting which be as important as the meeting itself.
USD/JPY 4-hour chart:


The broadly weaker US dollar sent USD/JPY below 137.46 support and invalidated the double bottom pattern. The bearish trend from the ‘intervention’ high remains very much in play, with its recent swing high finding resistance at the weekly pivot point and 50-bar EMA. The bias is for a move down to 134, although 135.78 makes a likely interim support level. The bias remains bearish below 138.15.
AUD/USD 4-hour chart:


The Aussie has broken out of a symmetrical triangle to the upside, in line with its 4-hour bullish trend. The pattern projects a target around 0.6900 which is also near the August VPOC – volume point of control – which can act as a magnet for prices. As the rally has stalled just below the weekly R1 pivot, we’d like to see a period of consolidation or retracement before reconsidering longs. And would seek dips down to 0.6750 for an anticipated move towards 0.6900.
How to trade with City Index
You can easily trade with City Index by using these four easy steps:
- Open an account, or log in if you’re already a customer
• Open an account in the UK
• Open an account in Australia
• Open an account in Singapore
- Search for the company you want to trade in our award-winning platform
- Choose your position and size, and your stop and limit levels
- Place the trade
How to trade with FOREX.com
Follow these easy steps to start trading with FOREX.com today:
- Open a Forex.com account, or log in if you’re already a customer.
- Search for the pair you want to trade in our award-winning platform.
- Choose your position and size, and your stop and limit levels.
- Place the trade.
Related tags:
Latest market news



The complete CFD trading experience
Award-winning platforms, competitive spreads, low commissions and dedicated support.
We live and breathe the markets and are dedicated to helping traders realise their ambitions as we continue to set the industry bar.
Economic calendar
Web Trader platform
Our sophisticated web-based platform is packed with features.
Related articles
EUR/USD weekly outlook: Oil, inflation and NFP in focus
After coming under significant pressure in recent weeks, the EUR/USD came off its lows to finish the week on a positive note on Friday, albeit with only a mild rebound. That was not enough to prevent the exchange rate falling for the third consecutive week, as the US dollar and bond yields rallied across the board.
Gold Q4 2026 outlook: Resilience in the face of rallying dollar and yields
As we headed towards the latter stages of Q3 and into Q4, the Fed had just hiked rates in a hawkish FOMC meeting, while the likes of the ECB and BoJ had also tightened their respective policies. Oil prices remained elevated amid the prolonged US-Iran conflict. Meanwhile, bond yields were breaking out, and the dollar was higher across the board. Yet, remarkably, gold was still holding in the positive territory for the third quarter, even if it had weakened somewhat in September.

Oil Quietly Hands the Fed a Reason to Stay Hawkish
Oil prices and the U.S. dollar are both on the front foot as elevated energy costs feed Fed warnings that inflation may prove sticky.
StoneX Europe Ltd may make third party material available on this website which may contain information included but not limited to the conditions of financial markets. The material is for information purposes only and does not contain, and should not be construed as containing, investment advice and/or investment recommendation and/or an investment research and/or an offer of or solicitation for any transactions in financial instruments; any decision to enter into a specific transaction shall be made by the client following an assessment by him/her of their situation.
StoneX Europe Ltd makes no representation or warranty and assumes no liability as to the accuracy or completeness of the information provided, nor any loss arising from any investment based on a recommendation, forecast or other information supplied. You should always seek independent advice as to your suitability to speculate in any related markets and your ability to assume the associated risks, if you are at all unsure. We are not under any obligation to update any such material. Any opinion made may be personal to the author and may not reflect the opinion of StoneX Europe Ltd.