



Pattern play Advanced Micro Devices
Upside breakout from a short-term bull flag.
Share this:
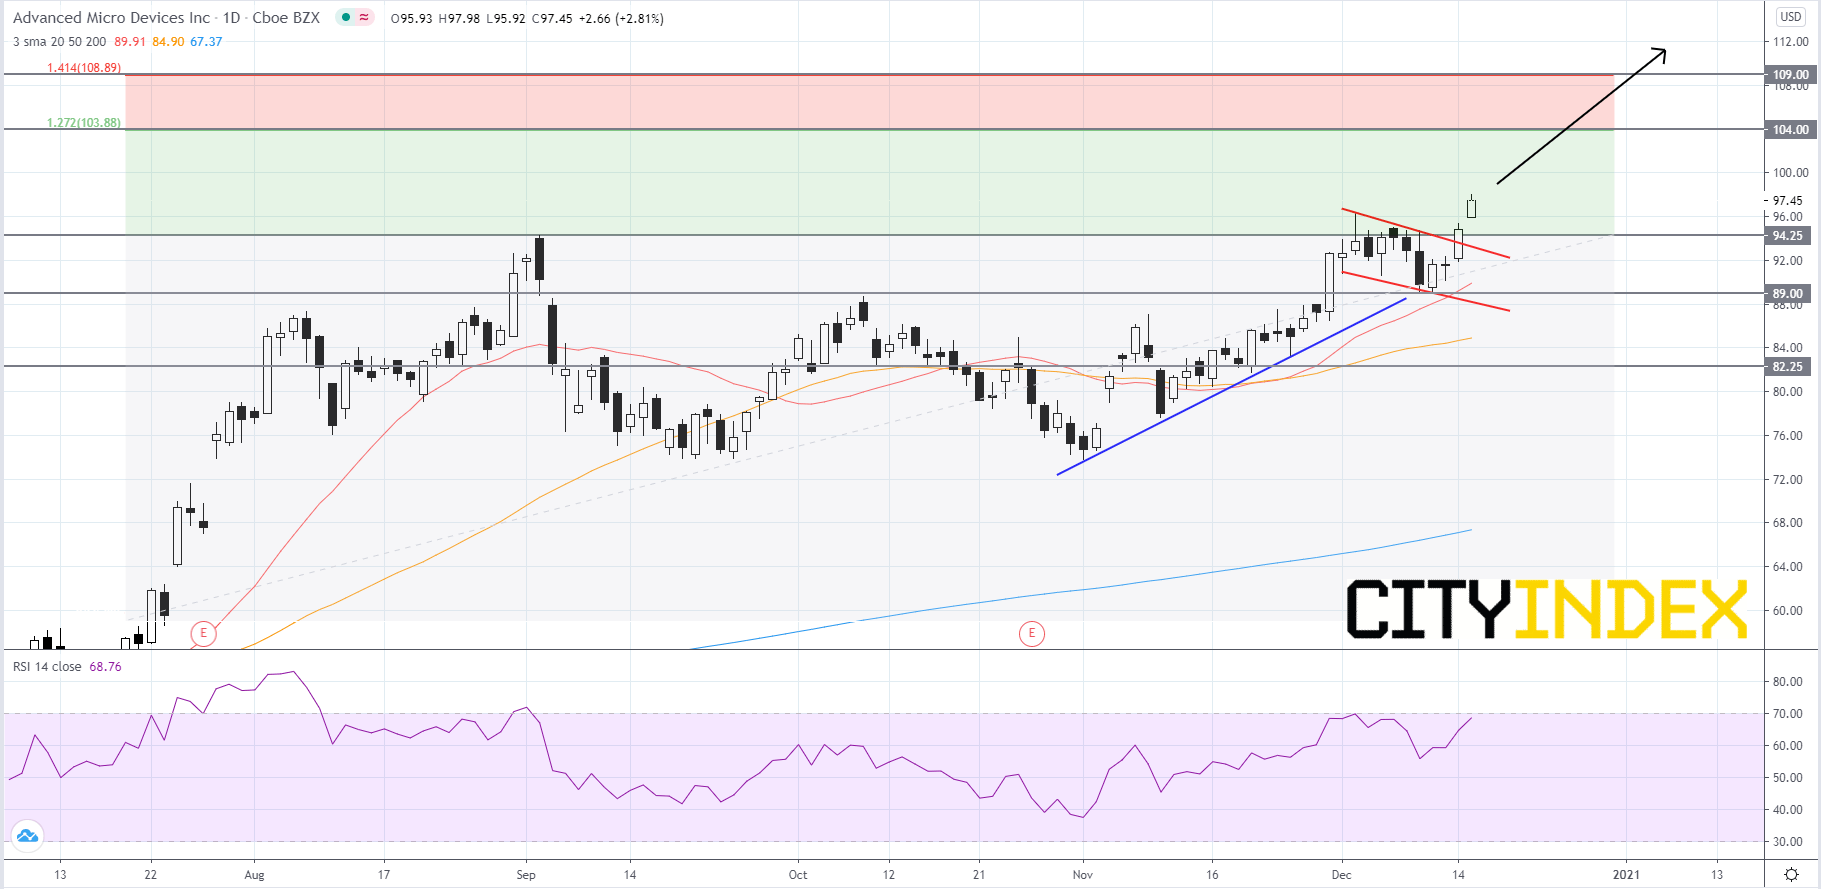
Advanced Micro Devices (AMD), a designer and producer of microprocessors, jumped to a record high after the company's stock price broke out to the upside of a short-term bull flag pattern that began to form at the beginning of November. The RSI is over 60 and showing bullish momentum. The simple moving averages (SMAs) are arranged in a bullish manner, with the 20-day SMA above the 50-day SMA and the 50-day SMA above the 200-day SMA. Price will likely advance towards the first Fibonacci target of 104.00. If price can breakout above 104.00 then its next Fibonacci target would be 109.00. If price surpasses 109.00 it will likely continue to run. On the other hand, if price retreats then traders should look to 94.25 for support. If 94.25 fails to hold price up then 89.00 would be the last line of defense. If price gets below 89.00 it would be a bearish signal, as price would be below its 20-day SMA and could slip to 82.25.
Source: GAIN Capital, TradingView
Source: GAIN Capital, TradingView
Advanced Micro Devices (AMD), a designer and producer of microprocessors, jumped to a record high after the company's stock price broke out to the upside of a short-term bull flag pattern that began to form at the beginning of November. The RSI is over 60 and showing bullish momentum. The simple moving averages (SMAs) are arranged in a bullish manner, with the 20-day SMA above the 50-day SMA and the 50-day SMA above the 200-day SMA. Price will likely advance towards the first Fibonacci target of 104.00. If price can breakout above 104.00 then its next Fibonacci target would be 109.00. If price surpasses 109.00 it will likely continue to run. On the other hand, if price retreats then traders should look to 94.25 for support. If 94.25 fails to hold price up then 89.00 would be the last line of defense. If price gets below 89.00 it would be a bearish signal, as price would be below its 20-day SMA and could slip to 82.25.

Source: GAIN Capital, TradingView
Source: GAIN Capital, TradingView
Related tags:
Latest market news




The complete CFD trading experience
Award-winning platforms, competitive spreads, low commissions and dedicated support.
We live and breathe the markets and are dedicated to helping traders realise their ambitions as we continue to set the industry bar.
Economic calendar
Web Trader platform
Our sophisticated web-based platform is packed with features.
Related articles
Gold Outlook: XAU/USD hit hard as US yields, dollar resume ascent
A stronger dollar, surging front-end yields and renewed geopolitical tension have combined to push gold back towards key technical support.
S&P 500, Nasdaq, Dow Forecast: Wall Street Split Widens Into Month-End 9 26 2026
Nasdaq strength contrasts with mounting Dow pressure as rising Treasury yields raise the stakes for stocks heading into the monthly close.


USD/JPY Weekly Outlook: Payrolls loom as US rates remain the dominant driver
Strong US growth and hawkish Fed pricing continue to support USD/JPY, while intervention risk appears to be kicking in at lower levels
StoneX Europe Ltd may make third party material available on this website which may contain information included but not limited to the conditions of financial markets. The material is for information purposes only and does not contain, and should not be construed as containing, investment advice and/or investment recommendation and/or an investment research and/or an offer of or solicitation for any transactions in financial instruments; any decision to enter into a specific transaction shall be made by the client following an assessment by him/her of their situation.
StoneX Europe Ltd makes no representation or warranty and assumes no liability as to the accuracy or completeness of the information provided, nor any loss arising from any investment based on a recommendation, forecast or other information supplied. You should always seek independent advice as to your suitability to speculate in any related markets and your ability to assume the associated risks, if you are at all unsure. We are not under any obligation to update any such material. Any opinion made may be personal to the author and may not reflect the opinion of StoneX Europe Ltd.