






Precarious situation now for Starbucks bulls in the medium term
Starbucks major uptrend phase at risk of being damaged.
Share this:

Medium-term technical outlook on Starbucks Corp (SBUX)
click to enlarge charts
Key Levels (1 to 3 weeks)
Pivot (key resistance): 84.94
Supports: 81.03 (trigger) & 74.80/73.70
Next resistance: 92.16
Directional Bias (1 to 3 weeks)
Bearish bias below 84.94 key medium-term pivotal resistance and a break below 81.03 reinforces the start of a multi-week corrective down move sequence to target the 74.80/73.70 support zone in the first step.
On the flipside, a clearance with a daily close above 84.94 negates the bearish tone for a rebound towards the next resistance at 92.16 (12 Sep 2019 swing high & 61.8% Fibonacci retracement of the on-going decline from 26 Jul high to 05 Nov 2019 low).
Key elements
- Since its all-time of 99.73 printed on 26 Jul 2019, the share price of SBUX has declined by 18% so far and it is now testing a major ascending trendline support in place since 28 Jun 2018 low.
- Also, it has traced out a series of “lower highs and lower lows” since 26 Jul 2019 that indicates the major uptrend phase from 28 Jun 2018 is at risk of transiting to a corrective down move phase.
- The daily RSI oscillator has already staged a bearish breakdown from a significant support (in parallel with the price action support from 28 Jun 2018 low) and retreated from it on 18 Nov 2019. These observations suggest that medium-term downside momentum remains intact and the major uptrend phase of SBUX since 28 Jun 2018 is at risk of being damaged.
- The 74.80/73.70 support zone is defined by a confluence of elements; the swing low areas of 17 Apr/29 May 2019, the lower boundary of a medium-term descending channel from 30 Aug 2019 high & a Fibonacci retracement/expansion cluster).
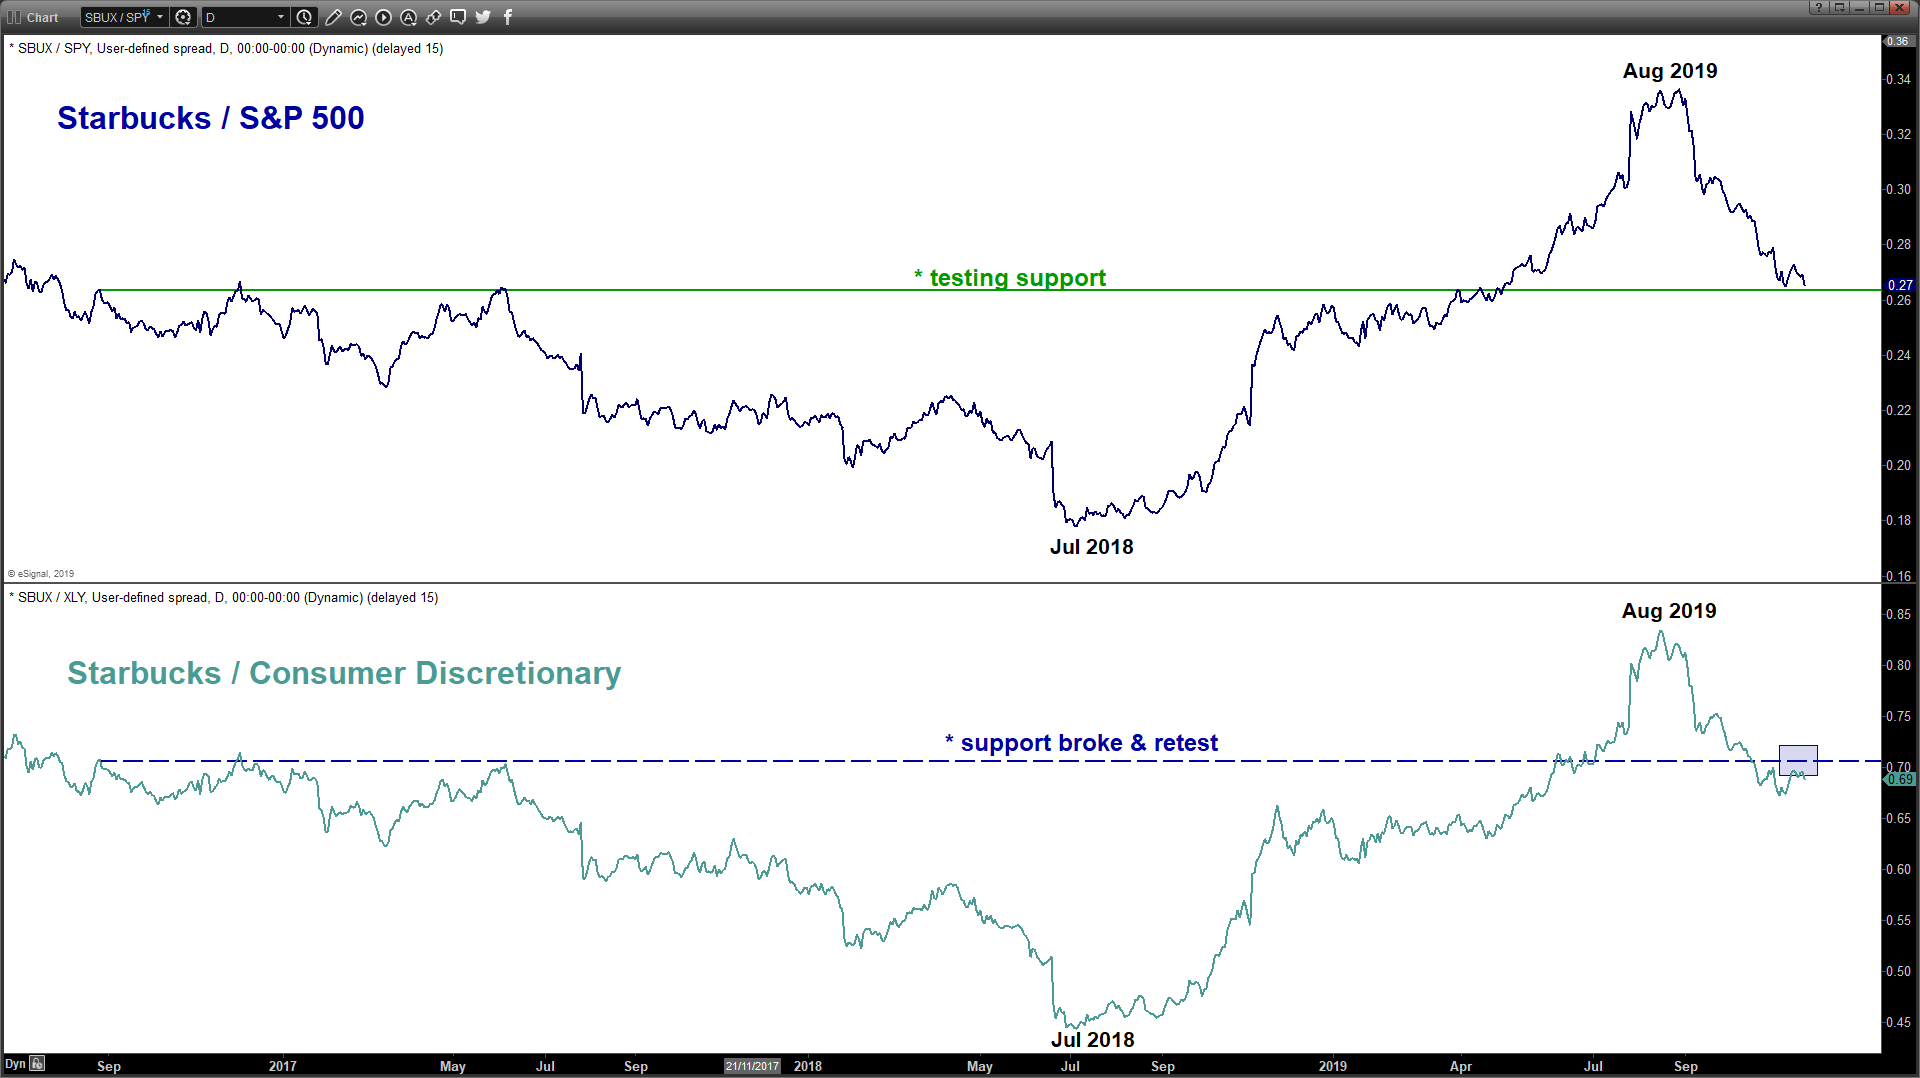
- Relative strength analysis from its ratio charts against the market (S&P 500) and its sector (Consumer Discretionary) suggest underperformance of Starbucks (SBUX).
Charts are from eSignal
Medium-term technical outlook on Starbucks Corp (SBUX)
click to enlarge charts
Key Levels (1 to 3 weeks)
Pivot (key resistance): 84.94
Supports: 81.03 (trigger) & 74.80/73.70
Next resistance: 92.16
Directional Bias (1 to 3 weeks)
Bearish bias below 84.94 key medium-term pivotal resistance and a break below 81.03 reinforces the start of a multi-week corrective down move sequence to target the 74.80/73.70 support zone in the first step.
On the flipside, a clearance with a daily close above 84.94 negates the bearish tone for a rebound towards the next resistance at 92.16 (12 Sep 2019 swing high & 61.8% Fibonacci retracement of the on-going decline from 26 Jul high to 05 Nov 2019 low).
Key elements
- Since its all-time of 99.73 printed on 26 Jul 2019, the share price of SBUX has declined by 18% so far and it is now testing a major ascending trendline support in place since 28 Jun 2018 low.
- Also, it has traced out a series of “lower highs and lower lows” since 26 Jul 2019 that indicates the major uptrend phase from 28 Jun 2018 is at risk of transiting to a corrective down move phase.
- The daily RSI oscillator has already staged a bearish breakdown from a significant support (in parallel with the price action support from 28 Jun 2018 low) and retreated from it on 18 Nov 2019. These observations suggest that medium-term downside momentum remains intact and the major uptrend phase of SBUX since 28 Jun 2018 is at risk of being damaged.
- The 74.80/73.70 support zone is defined by a confluence of elements; the swing low areas of 17 Apr/29 May 2019, the lower boundary of a medium-term descending channel from 30 Aug 2019 high & a Fibonacci retracement/expansion cluster).
- Relative strength analysis from its ratio charts against the market (S&P 500) and its sector (Consumer Discretionary) suggest underperformance of Starbucks (SBUX).
Charts are from eSignal
Related tags:
Latest market news




The complete CFD trading experience
Award-winning platforms, competitive spreads, low commissions and dedicated support.
We live and breathe the markets and are dedicated to helping traders realise their ambitions as we continue to set the industry bar.
Economic calendar
Web Trader platform
Our sophisticated web-based platform is packed with features.
Related articles

SK Hynix IPO: Everything You Need to Know About SK Hynix
Learn everything you need to know about the SK Hynix IPO, including its Nasdaq listing, valuation, financials, ownership, competitors and investment risks.


european market open trump china tariffs fed outlook gold dax rebound
European equities opened firmer on Monday as Trump’s softer weekend comments toward China eased trade fears and lifted sentiment after last week’s sharp sell-off. Gold hit a new record above $4,000/oz as safe-haven demand persisted, while oil rebounded modestly. Investors focus on the upcoming earnings deluge and Powell’s Tuesday speech amid the US shutdown. Asian trade was mixed, with China’s exports surprising to the upside and Japan closed for a holiday.

dax breakout apac markets chip tensions fed cuts gold oil forex
APAC equities softened following Wall Street’s pullback, while the DAX confirmed a breakout from a multi-month triangle, extending its bullish trend above key EMAs. China’s crackdown on NVIDIA chip imports and renewed US tariff rhetoric weighed on tech sentiment. Brent fell below $65 as the Gaza ceasefire eased geopolitical pressure, while gold steadied around $3,970/oz. Traders eye US CPI release timing amid the shutdown and the start of Q3 earnings season.
StoneX Europe Ltd may make third party material available on this website which may contain information included but not limited to the conditions of financial markets. The material is for information purposes only and does not contain, and should not be construed as containing, investment advice and/or investment recommendation and/or an investment research and/or an offer of or solicitation for any transactions in financial instruments; any decision to enter into a specific transaction shall be made by the client following an assessment by him/her of their situation.
StoneX Europe Ltd makes no representation or warranty and assumes no liability as to the accuracy or completeness of the information provided, nor any loss arising from any investment based on a recommendation, forecast or other information supplied. You should always seek independent advice as to your suitability to speculate in any related markets and your ability to assume the associated risks, if you are at all unsure. We are not under any obligation to update any such material. Any opinion made may be personal to the author and may not reflect the opinion of StoneX Europe Ltd.