



S&P 500 analysis: Extreme bearish positioning among speculators
The Turkish lira sank to a fresh record low against the US dollar as President Erdogan remained in the lead, although has yet to enjoy an outright majority.
Share this:

S&P 500 large speculator positioning (from the commitment of traders report):
As of Tuesday 9th May 2023:
- Net-short exposure was at it most bearish level since October 2011
- Gross-short exposure was at its most bullish level since June 2020
- Gross long exposure continued to trend lower, and is just above 17-year lows
- With such extreme positioning, prices either have to fall to justify bearish exposure or shorts may have to cover
- And that could see volatility increase as markets reprice, with US debt-ceiling talks providing a potential catalyst


Large speculators are very bearish on the S&P 500. In fact, net-exposure to the S&P 500 futures contract is at its most bearish level since October 2011, which was incidentally a major low for the index. With US debt-ceiling talks dragging on and a real risk that the US could default on its debt, investors are likely hedging their long portfolios with short-future positions and speculators are betting big on a fall.
Yet prices on the S&P 500 futures market remain elevated compared to its underlying net-short exposure. And that means prices will either have to move lower to justify the extremely short positioning, or shorts will have to cover which could result in a rally for the index.
S&P 500 futures weekly chart:
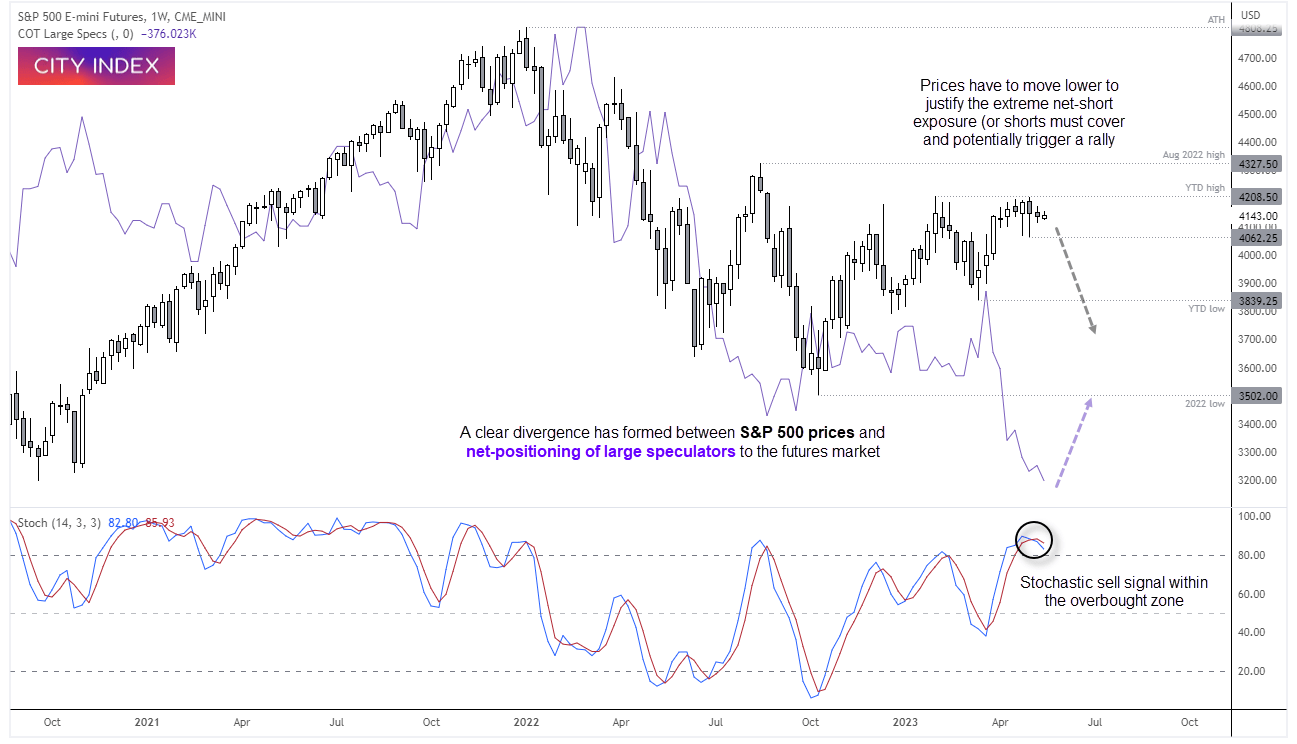
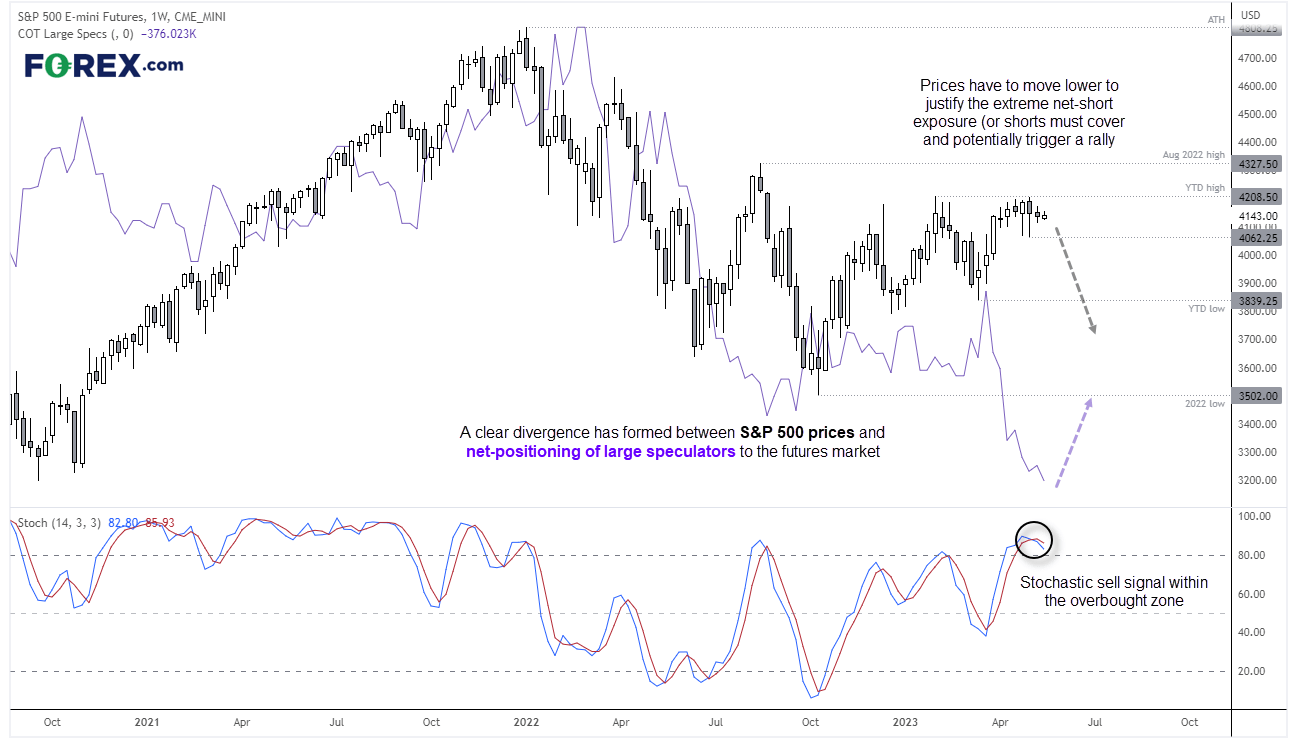
Of course, a less extreme scenario could see the two converge, with prices moving lower and net-short exposure diminishing. Yet with the clock ticking for the US debt ceiling, we have a building risk event that could prompt some serious repositioning amongst traders and provide a volatile reaction for markets.
As things stand, it is estimated that the US could default by June 1st if a resolution is not found. President Biden is set to resume talks with Republican speaker McCarthy today, although talks so far have failed to produce any progress. This has seen indices such as the S&P 500 remain within a low volatility holding pattern, with a mixture of hope a resolution can be found amidst concerns that one won’t.
S&P 500 seasonality:


With that said, seasonality does not generally favour higher levels of volatility this time of year, with returns in May and June being on the lower side compared to the rest of the year. Still, the past 30 years has generated gains in May 69% of the time, even if its high to low range is on the low side (and the variance of May data is the lowest of the year). But as seasonality essentially looks at an average of data, bit themes such as the debt ceiling can easily override seasonality anyway. And if anything, it provides a reason for markets to be awoken from their seasonal lull.
S&P 500 futures daily chart:
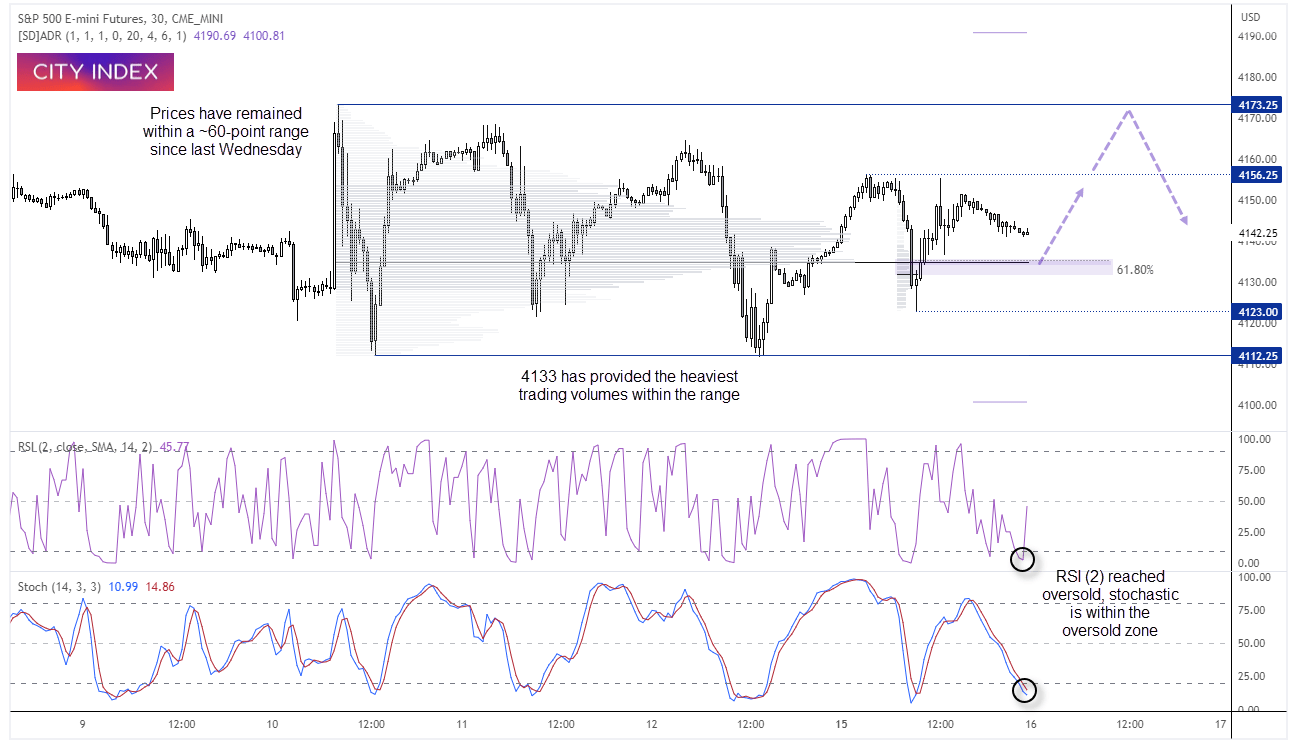

The S&P 500 E-mini futures have been confirmed within last Wednesday’s 60-point range, and the daily ranges are becoming smaller each day. That suggests we could be reaching a period of range expansion, but until a suitable catalyst arrives then range-trading strategies are preferred.
Note that there has been heavy trading activity around 4133 within the current range, and prices are drifting back towards this potential support zone ahead of the European and US opens. The RSI (2) reached oversold a few bars ago and the stochastic oscillator is within the overbought zone, although yet to generate a buy signal.
From here, we’re looking for a bullish setup around the support zone / 61.8% Fibonacci level and an initial retest of yesterday’s high, with the potential for a move for the highs around 4070.
-- Written by Matt Simpson
Follow Matt on Twitter @cLeverEdge
How to trade with City Index
You can trade with City Index by following these four easy steps:
- Open an account, or log in if you’re already a customer
• Open an account in the UK
• Open an account in Australia
• Open an account in Singapore
- Search for the market you want to trade in our award-winning platform
- Choose your position and size, and your stop and limit levels
- Place the trade
Related tags:
Latest market news




The complete CFD trading experience
Award-winning platforms, competitive spreads, low commissions and dedicated support.
We live and breathe the markets and are dedicated to helping traders realise their ambitions as we continue to set the industry bar.
Economic calendar
Web Trader platform
Our sophisticated web-based platform is packed with features.
Related articles
Gold Q4 2026 outlook: Resilience in the face of rallying dollar and yields
As we headed towards the latter stages of Q3 and into Q4, the Fed had just hiked rates in a hawkish FOMC meeting, while the likes of the ECB and BoJ had also tightened their respective policies. Oil prices remained elevated amid the prolonged US-Iran conflict. Meanwhile, bond yields were breaking out, and the dollar was higher across the board. Yet, remarkably, gold was still holding in the positive territory for the third quarter, even if it had weakened somewhat in September.

Equity Indices Q4, 2026 Outlook: Cracks Begin to Show
There's still an open door for a melt-up in the S&P 500 and Nasdaq but the Dow and Russell 2000 are looking more vulnerable, and until calm hits the Treasuries market there's a higher probability for volatility. The big question is whether that's a next quarter theme or not.

S&P 500 Forecast: SPX rises as oil prices fall, but treasuries remain at multi-decade highs
U.S. stocks are rising on Friday after a volatile week that saw a surge in Treasury yields ripple through financial markets.

StoneX Europe Ltd may make third party material available on this website which may contain information included but not limited to the conditions of financial markets. The material is for information purposes only and does not contain, and should not be construed as containing, investment advice and/or investment recommendation and/or an investment research and/or an offer of or solicitation for any transactions in financial instruments; any decision to enter into a specific transaction shall be made by the client following an assessment by him/her of their situation.
StoneX Europe Ltd makes no representation or warranty and assumes no liability as to the accuracy or completeness of the information provided, nor any loss arising from any investment based on a recommendation, forecast or other information supplied. You should always seek independent advice as to your suitability to speculate in any related markets and your ability to assume the associated risks, if you are at all unsure. We are not under any obligation to update any such material. Any opinion made may be personal to the author and may not reflect the opinion of StoneX Europe Ltd.