





SP500 Eyes Record Highs Nikkei Appears Less Confident
Trade tensions are thawing, Trump and Xi are besties again, and risk appetite is being allowed to blossom as a result.
Share this:

Trade tensions are thawing, Trump and Xi are besties again, allowing risk assets to rally as a result. Still, some appear more bullish than others...
The S&P500 has record highs within easy reach and momentum suggests we could test this key milestone over by the end of the week. The breakout from range was seen on a gap high. That is hasn’t been filled is another sign as strength, as such a move is considered to be a breakaway gap, which tends to occur at the beginning of a move after leaving a basing pattern.
- A small bullish doji marks the swing low at 2,957. As the gap has not been filled, we remain bullish above the structural low.
- The S&P500 closed just above the 3k milestone but, due to the positive sentiment across markets, we expect it to re-test the record highs this week (and possibly even today). There’s also no bearish divergence with RSI, and it hasn’t reached overbought on the four-hour chart.
- As this is such a key level, it’s plausible to expect a price reaction triggered by profit taking. Yet the bullish structure assumes an eventual break higher and for 2,957 to remain untested ahead of the breakout.
- We’d keep an open target at new highs and trail a stop accordingly.
The FTSE 100 came close to breaking 7,400, although there’s no cigar yet. The index has crept back from yesterday’s high in early trade, but if it can hold above the 7,300 area then perhaps a breakout is imminent. A tad on the messy side, but there’s a pattern reminiscent of an inverted head and shoulders. However, the FTSE is mostly being propped up by a global shift in sentiment and recent gains have failed to keep up with ay of its peers (such as the DAX), so we suspect upside may be limited.
- Look for 7,300 to support to hold ahead of a break above 7,400. The internal trendline can be used as an interim target.
- As FTSE has lagged its peers, we’re bullish near-term but cautions further out.
- A break below 7,200 invalidates the near-term bullish bias.
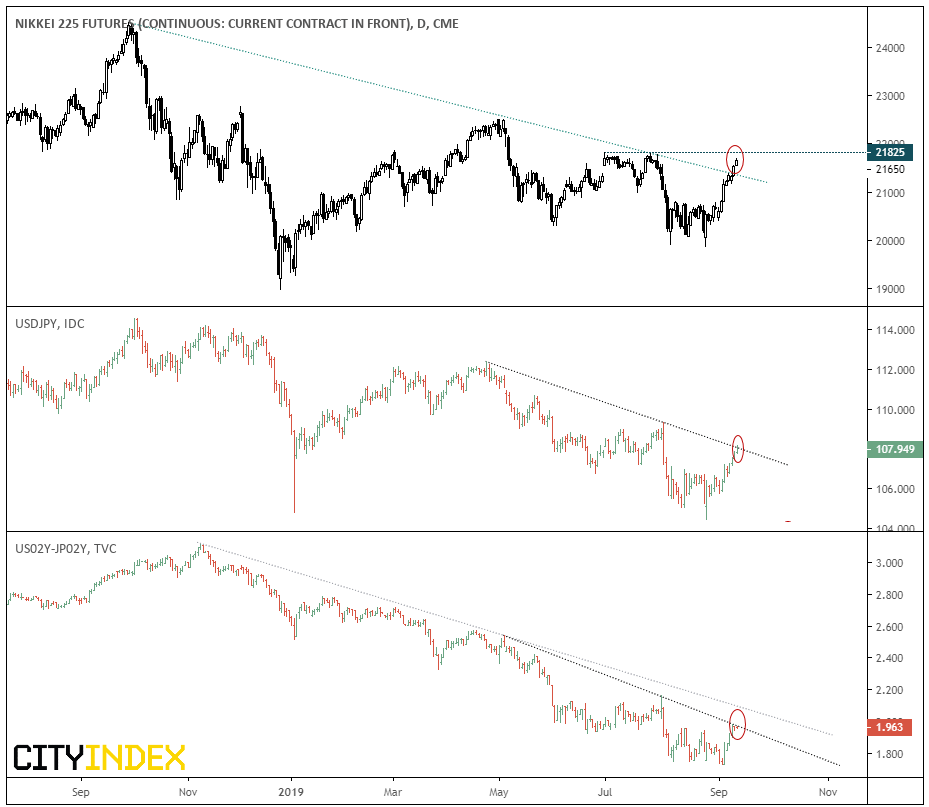
The Nikki has broken the bearish trendline from the September high, trades just beneath the July highs. As it trades just near a resistance level, it entices the potential for a pullback. However, the probability of a retracement appears highs because USD/JPY and the US2-JP2 yr yield differentials have also tested their bearish trendlines.
- Counter-trend trades could look to fade into minor rallies beneath 2,185, and seek a target around the broken trendline
- Bulls could seek to buy a dip once a new level of support has been established.
- Alternatively, bulls could look to wait for a break above 2,185 before entering long, especially if we see US indices break to new highs (along with USD/JPY and the US2-JP2 differential.
Related analysis:
Nasdaq bounce shoves aside value ‘comeback’
DJIA: Record Highs in Sight After Better-Than-Expected Q2 Earnings Season
With Trade Talks Back On The Menu, Indices Rise For The Occasion | S&P500, DAX
Index Pairs Matrix | Ratio Performance At A Glance
Trade tensions are thawing, Trump and Xi are besties again, allowing risk assets to rally as a result. Still, some appear more bullish than others...
The S&P500 has record highs within easy reach and momentum suggests we could test this key milestone over by the end of the week. The breakout from range was seen on a gap high. That is hasn’t been filled is another sign as strength, as such a move is considered to be a breakaway gap, which tends to occur at the beginning of a move after leaving a basing pattern.
- A small bullish doji marks the swing low at 2,957. As the gap has not been filled, we remain bullish above the structural low.
- The S&P500 closed just above the 3k milestone but, due to the positive sentiment across markets, we expect it to re-test the record highs this week (and possibly even today). There’s also no bearish divergence with RSI, and it hasn’t reached overbought on the four-hour chart.
- As this is such a key level, it’s plausible to expect a price reaction triggered by profit taking. Yet the bullish structure assumes an eventual break higher and for 2,957 to remain untested ahead of the breakout.
- We’d keep an open target at new highs and trail a stop accordingly.
The FTSE 100 came close to breaking 7,400, although there’s no cigar yet. The index has crept back from yesterday’s high in early trade, but if it can hold above the 7,300 area then perhaps a breakout is imminent. A tad on the messy side, but there’s a pattern reminiscent of an inverted head and shoulders. However, the FTSE is mostly being propped up by a global shift in sentiment and recent gains have failed to keep up with ay of its peers (such as the DAX), so we suspect upside may be limited.
- Look for 7,300 to support to hold ahead of a break above 7,400. The internal trendline can be used as an interim target.
- As FTSE has lagged its peers, we’re bullish near-term but cautions further out.
- A break below 7,200 invalidates the near-term bullish bias.
The Nikki has broken the bearish trendline from the September high, trades just beneath the July highs. As it trades just near a resistance level, it entices the potential for a pullback. However, the probability of a retracement appears highs because USD/JPY and the US2-JP2 yr yield differentials have also tested their bearish trendlines.
- Counter-trend trades could look to fade into minor rallies beneath 2,185, and seek a target around the broken trendline
- Bulls could seek to buy a dip once a new level of support has been established.
- Alternatively, bulls could look to wait for a break above 2,185 before entering long, especially if we see US indices break to new highs (along with USD/JPY and the US2-JP2 differential.
Related analysis:
Nasdaq bounce shoves aside value ‘comeback’
DJIA: Record Highs in Sight After Better-Than-Expected Q2 Earnings Season
With Trade Talks Back On The Menu, Indices Rise For The Occasion | S&P500, DAX
Index Pairs Matrix | Ratio Performance At A Glance
Latest market news




The complete CFD trading experience
Award-winning platforms, competitive spreads, low commissions and dedicated support.
We live and breathe the markets and are dedicated to helping traders realise their ambitions as we continue to set the industry bar.
Economic calendar
Web Trader platform
Our sophisticated web-based platform is packed with features.
Related articles

S&P 500 forecast: Stocks extend drop as correction risks grow
US and global equity markets have extended Wednesday’s sell-off, with Wall Street opening lower after a weak handover from Asia and Europe. The deterioration in risk appetite has been spreading across global markets. The dollar was firmer, Treasury yields were holding onto yesterday’s gains, while gold, silver and bitcoin were all under pressure alongside equities and major currencies.

Nikkei threatens breakout as tech rebound broadens
Breakouts across the SOX and Nasdaq are being matched by rebounds across Asia, with the Nikkei now threatening to join the move.


Nasdaq 100 Forecast: Confidence Returns as the Index Challenges Record Highs
The trading week is getting underway with renewed bullish momentum across Nasdaq. This is reflected in today's session, where the index has gained more than 2.5%, highlighting a buying bias that has not been observed with this level of strength in several weeks.

StoneX Europe Ltd may make third party material available on this website which may contain information included but not limited to the conditions of financial markets. The material is for information purposes only and does not contain, and should not be construed as containing, investment advice and/or investment recommendation and/or an investment research and/or an offer of or solicitation for any transactions in financial instruments; any decision to enter into a specific transaction shall be made by the client following an assessment by him/her of their situation.
StoneX Europe Ltd makes no representation or warranty and assumes no liability as to the accuracy or completeness of the information provided, nor any loss arising from any investment based on a recommendation, forecast or other information supplied. You should always seek independent advice as to your suitability to speculate in any related markets and your ability to assume the associated risks, if you are at all unsure. We are not under any obligation to update any such material. Any opinion made may be personal to the author and may not reflect the opinion of StoneX Europe Ltd.