





Stocks reverse while yields hammer out a bottom
What is the catalyst that will help stocks to continue to move higher and bonds move lower (yields higher)?
Share this:

Turnaround Tuesday strikes again! Stocks reversed course today and are up nearly 1.75% as the S&P 500 traded above yesterday’s highs, near 4328. Just as we have seen several times since the large index began forming the rising wedge in the fall of 2020, a large selloff one day as been followed by a larger positive move the next day. Today’s move resembles that of June 22nd, when price reversed the previous day’s selloff and continued moving higher within the wedge. The key for the S&P 500 will be to see if the index can close back into the wedge and make new highs, just as it has been doing for the last 9 months. However, if the index fails and closes below the July 19th lows and horizontal support, it can easily move to the June 21st lows of 4252.75.
Source: Tradingview, City Index
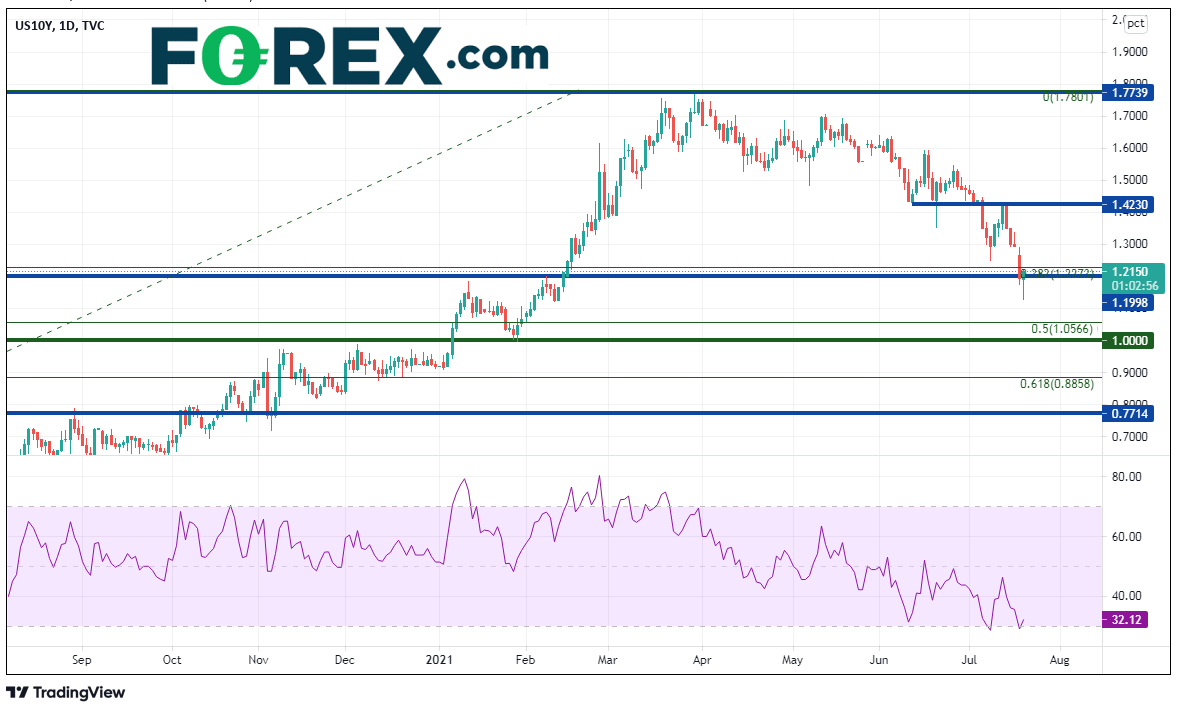
The candlestick formation on a daily chart of 10-year yields is a hammer formation, in which yields open near yesterday’s close, make a new low, and recover to close near the highs of the day. A hammer is a one candle reversal signal. The benchmark yields moved as lows as 1.129 today before reversing, as it struggles to hold a key level near horizontal support at 1.200 and the 38.2% Fibonacci retracement level from the March 9th, 2020 lows to the March 30, 2021 highs near 1.227. Monday’s highs provide first resistance at 1.2900, ahead of horizontal resistance at 1.423. Support below Tuesday’s low is the 50% retracement level from the previously mentioned timeframe near 1.056 and then the psychological round number support level of 1.000. Notice that yields in a new low today while the RSI did not!
Source: Tradingview, City Index
Japanese candlestick cheatsheet
If the S&P 500 is going to continue to move higher, its going to have to take out trendline resistance and make new all-time highs. The hammer in yields confirms the move higher in stocks today. The question traders need to be asking right now is: What is the catalyst that will help stocks to continue to move higher and bonds move lower (yields higher)?
Turnaround Tuesday strikes again! Stocks reversed course today and are up nearly 1.75% as the S&P 500 traded above yesterday’s highs, near 4328. Just as we have seen several times since the large index began forming the rising wedge in the fall of 2020, a large selloff one day as been followed by a larger positive move the next day. Today’s move resembles that of June 22nd, when price reversed the previous day’s selloff and continued moving higher within the wedge. The key for the S&P 500 will be to see if the index can close back into the wedge and make new highs, just as it has been doing for the last 9 months. However, if the index fails and closes below the July 19th lows and horizontal support, it can easily move to the June 21st lows of 4252.75.
Source: Tradingview, FOREX.com
The candlestick formation on a daily chart of 10-year yields is a hammer formation, in which yields open near yesterday’s close, make a new low, and recover to close near the highs of the day. A hammer is a one candle reversal signal. The benchmark yields moved as lows as 1.129 today before reversing, as it struggles to hold a key level near horizontal support at 1.200 and the 38.2% Fibonacci retracement level from the March 9th, 2020 lows to the March 30, 2021 highs near 1.227. Monday’s highs provide first resistance at 1.2900, ahead of horizontal resistance at 1.423. Support below Tuesday’s low is the 50% retracement level from the previously mentioned timeframe near 1.056 and then the psychological round number support level of 1.000. Notice that yields in a new low today while the RSI did not!
Source: Tradingview, FOREX.com
Japanese candlestick cheatsheet
If the S&P 500 is going to continue to move higher, its going to have to take out trendline resistance and make new all-time highs. The hammer in yields confirms the move higher in stocks today. The question traders need to be asking right now is: What is the catalyst that will help stocks to continue to move higher and bonds move lower (yields higher)?
Related tags:



The complete CFD trading experience
Award-winning platforms, competitive spreads, low commissions and dedicated support.
We live and breathe the markets and are dedicated to helping traders realise their ambitions as we continue to set the industry bar.
Economic calendar
Web Trader platform
Our sophisticated web-based platform is packed with features.
Related articles
Gold forecast: Rising yields become too hot for gold, but the outlook is far from bearish
Gold and silver prices took a plunge today, with the former down 3% and the latter falling some 5% by mid European session, before bouncing off their lows. The losses come after the metals remained largely supported until last week, despite the big dollar rally and surging bond yields as we have seen in recent weeks. But it simply got too much, and the metals succumbed to pressure today.

AUD/USD forecast: Currency Pair of the Week | September 28, 2026
The week has started with stocks, gold, silver and bitcoin all falling, as crude oil rebounded and bond yields pushed further higher. Trump refusing to agree to Tehran’s proposal to re-open the Strait of Hormuz has left the markets disappointed. Still, reports that mediators are expected to hold talks with the two sides on an amended version of the 7-day proposal that Iran presented, keeps hopes alive that we may see some progress.

Gold Outlook: XAU/USD hit hard as US yields, dollar resume ascent
A stronger dollar, surging front-end yields and renewed geopolitical tension have combined to push gold back towards key technical support.

StoneX Europe Ltd may make third party material available on this website which may contain information included but not limited to the conditions of financial markets. The material is for information purposes only and does not contain, and should not be construed as containing, investment advice and/or investment recommendation and/or an investment research and/or an offer of or solicitation for any transactions in financial instruments; any decision to enter into a specific transaction shall be made by the client following an assessment by him/her of their situation.
StoneX Europe Ltd makes no representation or warranty and assumes no liability as to the accuracy or completeness of the information provided, nor any loss arising from any investment based on a recommendation, forecast or other information supplied. You should always seek independent advice as to your suitability to speculate in any related markets and your ability to assume the associated risks, if you are at all unsure. We are not under any obligation to update any such material. Any opinion made may be personal to the author and may not reflect the opinion of StoneX Europe Ltd.