



Two trades to watch: EUR/GBP, S&P500
EUR/GBP falls as the UK economy proves to be resilient, contracting less than forecast in December. S&P 500 extends declines after US CPI hit 7.5% and bets rise of a 50 basis point rate hike in March
Share this:

EUR/GBP falls as Omicron hit not as bad as feared
The Pound is strengthening after data revealed that the UK economy was more resilient than expected at the end of last year. UK GDP contracted just -0.2% in December, better than the -0.5% contraction forecast. On a quarterly basis GDP rose 1%, slightly off the 1.1% forecast.
The Omicron hit has proved to be much more contained that feared. Strong economic growth gives the BoE room to hike rates to tame surging inflation.
The euro is coming under pressure, partly owing to the rally in the USD following the hotter than expected inflation print. There were no surprises from German inflation which slowed to 4.9% in January from 5.3%. However, PPI rose to 16.2% suggesting that CPI could still run hotter.
Where next for EUR/GBP?
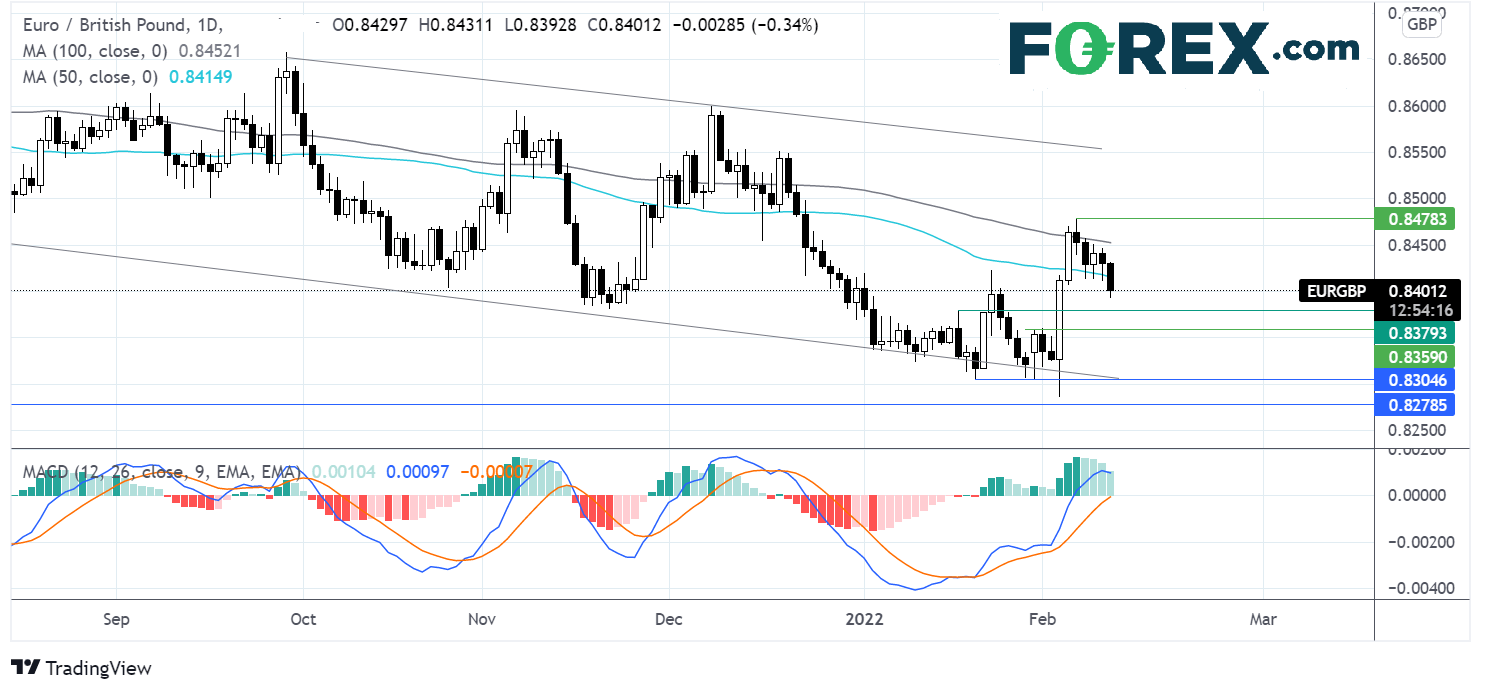
EUR/GBP failed to meaningfully break above the 100 sma resistance and rebounded lower. The price falling below the 50 sma, combined with the receding bullish bias on the MACD points to further losses.
Sellers will look for a move below 0.84 round number to attack 0.8374 January 18 high and 0.8360 February 1 high.
Buyers will look for a move above 0.8450 the 100 sma to cement further gains towards 0.8478 the 2022 high.

S&P 500 extends decline, tests 200 sma
The S&P 500 slumped yesterday following the 7.5%, hotter than forecast US inflation print, and the futures are heading lower again today.
St Louis Federal Reserve President James Bullard said that the data had turned him more hawkish and that he wants to see rate 100 basis points higher by July 1. His comments further fueled bets of a 50-basis points rate hike in March.
According to the CME Fed watch tool, there is a 94% probability of a 50-basis point rate hike in March.
US 10-year treasury yields shot over 2% hurting demand for stocks. Yields have eased slightly taking allowing futures to rise from sessions lows.
Where next for the S&P500?
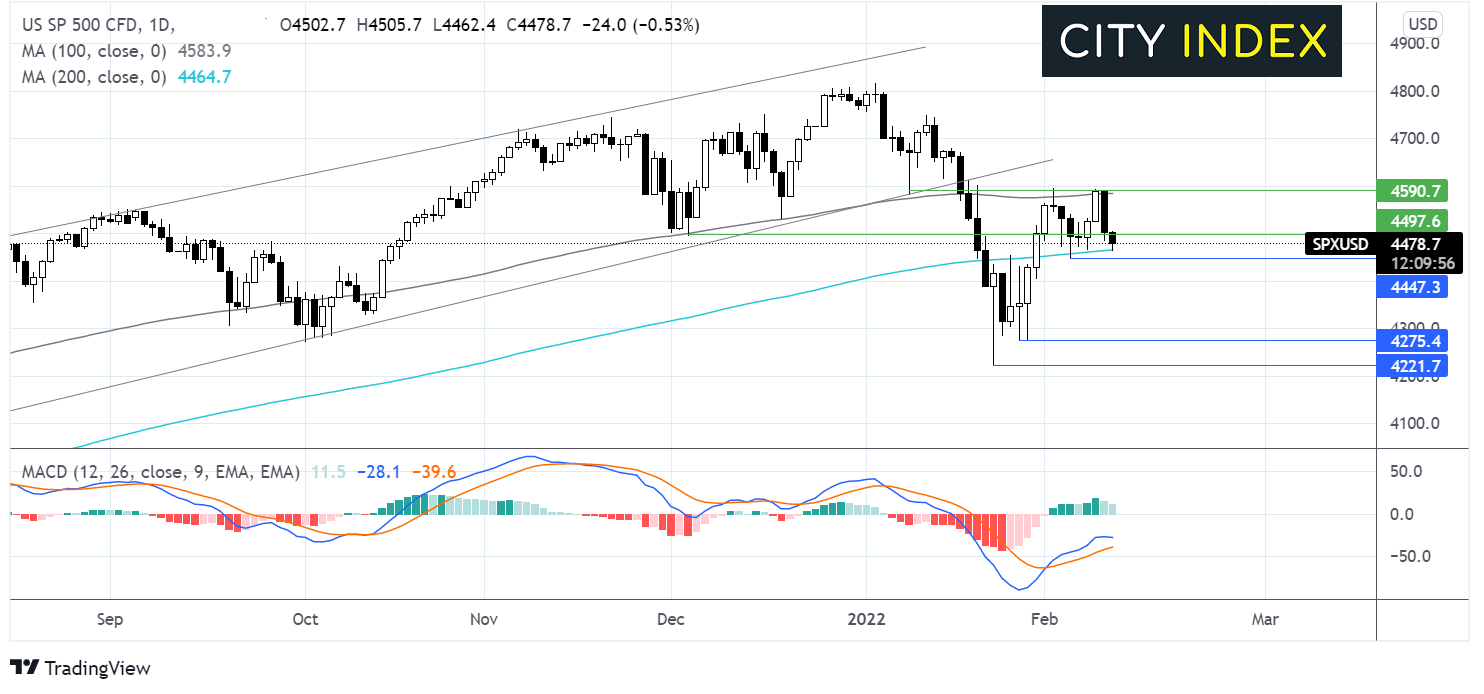
The S&P 500 failed to move above the 100 sma, falling sharply lower, the bearish engulfing candle and the receding bullish bias on the MACD indicating further losses could be coming.
The 200 sma is offering support sellers will need to take out this support around 4450 and the Feb low for sellers to gain traction towards 440-0 round number.
Buyers will be looking for a move over 4500 round number to attack resistance at 4590 the 100 sma. A move above here would be a significant bullish sign.
How to trade with City Index
Follow these easy steps to start trading with City Index today:
- Open a City Index account, or log-in if you’re already a customer.
- Search for the market you want to trade in our award-winning platform.
- Choose your position and size, and your stop and limit levels
- Place the trade.
Related tags:
Latest market news



The complete CFD trading experience
Award-winning platforms, competitive spreads, low commissions and dedicated support.
We live and breathe the markets and are dedicated to helping traders realise their ambitions as we continue to set the industry bar.
Economic calendar
Web Trader platform
Our sophisticated web-based platform is packed with features.
Related articles
S&P 500 forecast: Stocks extend drop as correction risks grow
US and global equity markets have extended Wednesday’s sell-off, with Wall Street opening lower after a weak handover from Asia and Europe. The deterioration in risk appetite has been spreading across global markets. The dollar was firmer, Treasury yields were holding onto yesterday’s gains, while gold, silver and bitcoin were all under pressure alongside equities and major currencies.
Gold forecast: XAU/USD could take a larger dive after the big rise in yields
Gold prices have been falling in the last few days after last week’s post-FOMC pop faded amid rising interest rate expectations, higher oil prices and a strengthening US dollar. As before, I wasn’t convinced gold would thrive in the current macro backdrop.

USD/JPY outlook: Hawkish Fed recalibration pressures the yen
Stronger US growth momentum and rising Treasury yields are keeping USD/JPY pointed higher, even as Japanese policymakers try to limit the pressure building across domestic markets.

StoneX Europe Ltd may make third party material available on this website which may contain information included but not limited to the conditions of financial markets. The material is for information purposes only and does not contain, and should not be construed as containing, investment advice and/or investment recommendation and/or an investment research and/or an offer of or solicitation for any transactions in financial instruments; any decision to enter into a specific transaction shall be made by the client following an assessment by him/her of their situation.
StoneX Europe Ltd makes no representation or warranty and assumes no liability as to the accuracy or completeness of the information provided, nor any loss arising from any investment based on a recommendation, forecast or other information supplied. You should always seek independent advice as to your suitability to speculate in any related markets and your ability to assume the associated risks, if you are at all unsure. We are not under any obligation to update any such material. Any opinion made may be personal to the author and may not reflect the opinion of StoneX Europe Ltd.