



Two trades to watch: Oil, AUD/JPY
WTI oil falls as Shanghai enters lockdown. AUDJPY surges after dovish BoJ, Australian infrastructure spend.
Share this:

WTI oil falls as Shanghai enters lockdown
Oil prices are tumbling lower after China announced a partial lockdown in Shanghai, the financial hub home to 25 million people.
COVID cases in the city have risen quickly, and China maintains its zero-COVID policy. The move has prompted demand fears.
The drop in oil comes after an 8% rise in prices last week, and as oil is set to rise 14% across the month of March amid the ongoing Russia Ukraine war, which sparked supply fears.
Russia is the world’s second-largest oil exporter of around 5 million barrels a day. Estimates suggest between 1-3 million barrels a day may not make it to market.
Where next for oil prices?
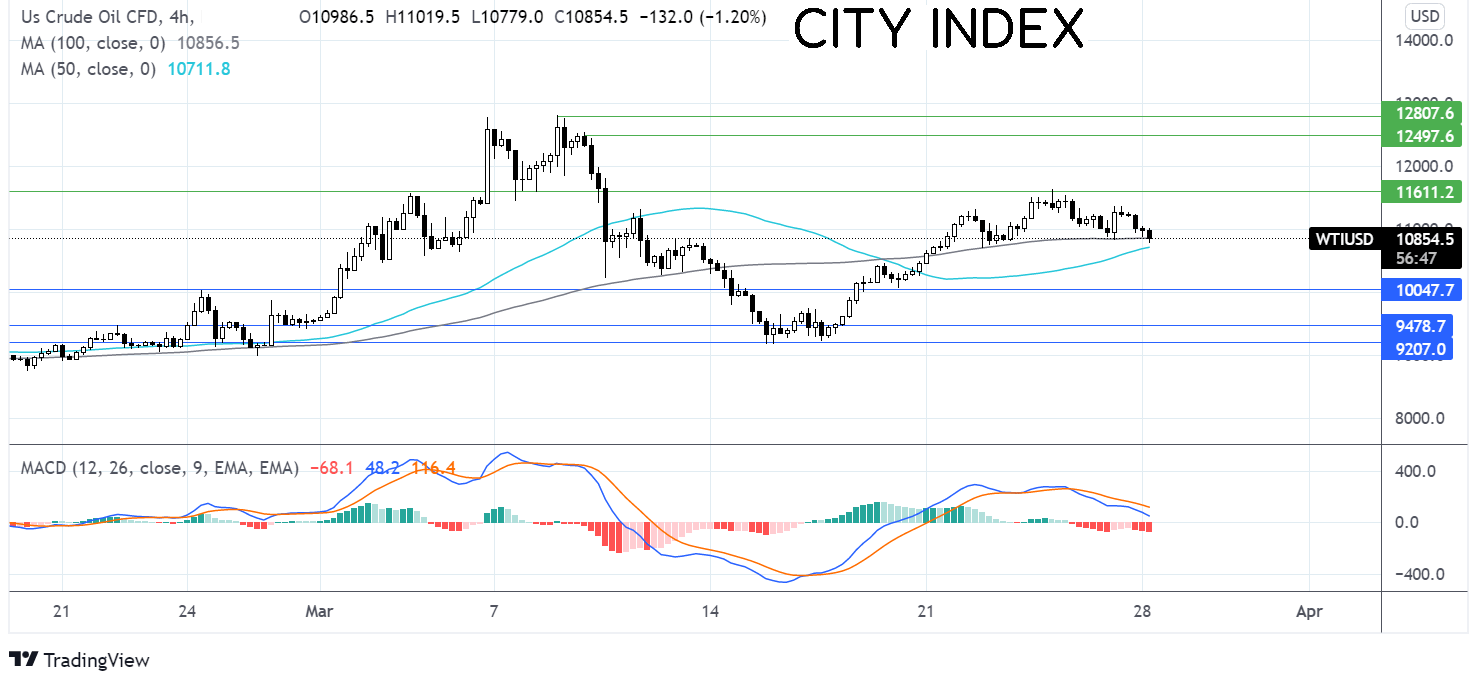
WTI oil traded relatively range-bound last week, with gains limited by 116.30 and losses limited by the 100 SMA on the four-hour chart around 108.50.
The MACD hints towards further declines, and sellers could gain traction if the zero line is crossed. Sellers would need to break below the 100 SMA at 108.50, exposing the 50 sna at 107.20. A break below here could open the door to the critical psychological level at $100.
Buyers could look for a move over 116.30 to 125.00, the March 9 high ahead of 128.20.

AUDJPY surges after dovish BoJ, Australian infrastructure spend
AUDJPY rise to a seven-year high after the BoJ offered to buy an unlimited amount of JGBs at 0.25% in a dovish move by the central bank.
Meanwhile, the Aussie is bounding higher, boosted by an announcement of AUD$17.9 billion in infrastructure spending by Prime Minister Morrison ahead of the coming elections in May.
The AUD could find gains are limited by the lockdown in China and the general risk-off mood in the market, which often hurts demand for the riskier Aussie.
Looking ahead, Australian retail sales data is due and is expected to show sales rose 1% MoM in February, slightly down from the 1.5% rise in January.
Where next for AUDJPY?
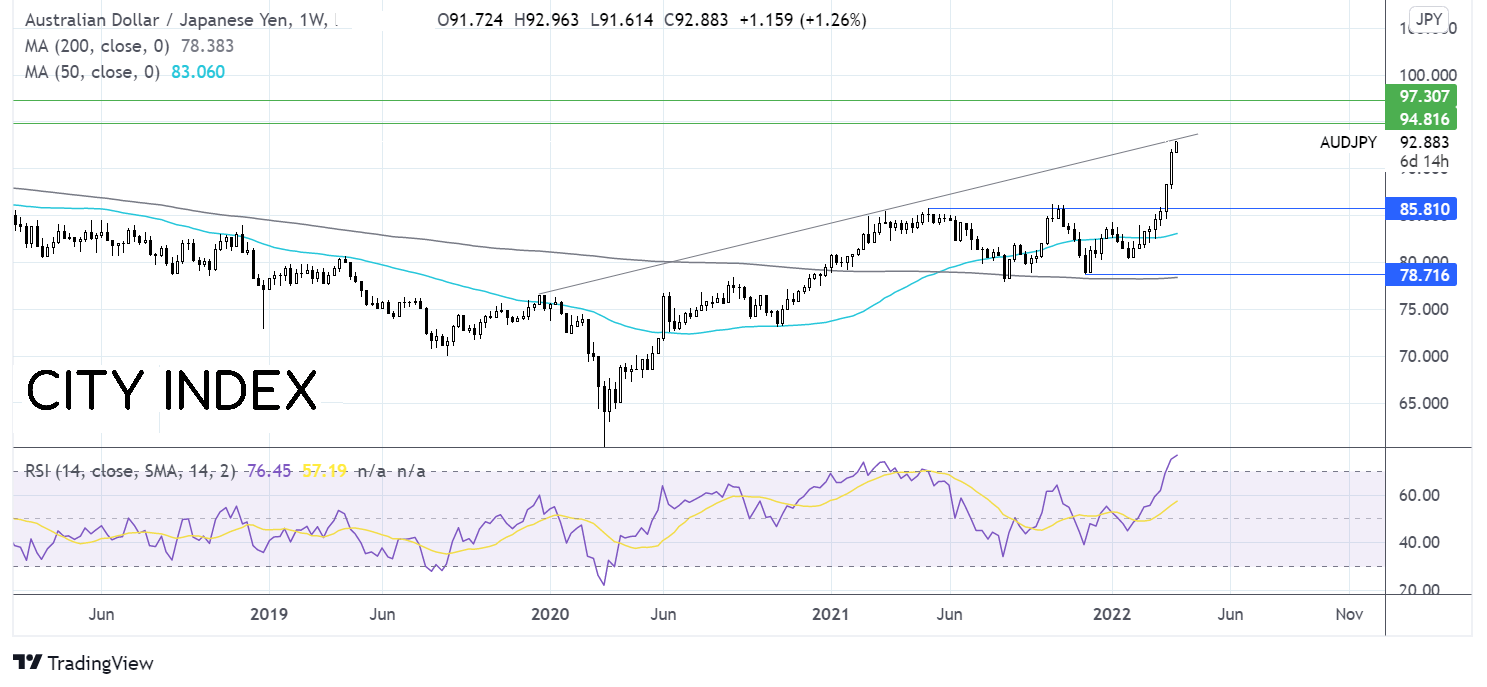
AUDJPY broke out of its trading range within which it traded since May last year, pushing above 85.50 and propelling higher. The price has run into resistance at 93, the rising trendline dating to late 2019.
The RSI has pushed into overbought territory, so some consolidation at this level; could be on the cards before further gains.
A break above the multi-year rising trendline could see bulls look to 94.70, the March 2015 high ahead of 97.50 the 2015 high.
Sellers would look for a move below 86 to negate the current uptrend and expose the 50 sma at 83.00.
How to trade with City Index
Follow these easy steps to start trading with City Index today:
- Open a City Index account, or log-in if you’re already a customer.
- Search for the market you want to trade in our award-winning platform.
- Choose your position and size, and your stop and limit levels
- Place the trade.
Related tags:



The complete CFD trading experience
Award-winning platforms, competitive spreads, low commissions and dedicated support.
We live and breathe the markets and are dedicated to helping traders realise their ambitions as we continue to set the industry bar.
Economic calendar
Web Trader platform
Our sophisticated web-based platform is packed with features.
Related articles
NZD/USD pressure mounts as payrolls looms large
NZD/USD has fallen sharply as Fed rate expectations reset higher, but extreme downside stretch and major support raise the risk of a violent counter-trend rebound.

US Core PCE Preview: Stale or Significant for the Fed
Core PCE inflation takes center stage Wednesday, with traders watching for signs of renewed price pressure and clues on whether the Fed could hike again in October.


Australian Dollar Forecast: AUD/USD Four-Week Slide Nears Critical Uptrend Support 9 29 2026
Aussie momentum has deteriorated sharply into quarter-end, with inflation, Core PCE and NFP on tap as AUD/USD closes in on a pivotal technical threshold.

StoneX Europe Ltd may make third party material available on this website which may contain information included but not limited to the conditions of financial markets. The material is for information purposes only and does not contain, and should not be construed as containing, investment advice and/or investment recommendation and/or an investment research and/or an offer of or solicitation for any transactions in financial instruments; any decision to enter into a specific transaction shall be made by the client following an assessment by him/her of their situation.
StoneX Europe Ltd makes no representation or warranty and assumes no liability as to the accuracy or completeness of the information provided, nor any loss arising from any investment based on a recommendation, forecast or other information supplied. You should always seek independent advice as to your suitability to speculate in any related markets and your ability to assume the associated risks, if you are at all unsure. We are not under any obligation to update any such material. Any opinion made may be personal to the author and may not reflect the opinion of StoneX Europe Ltd.