





US dollar forecast: A closer look at the dollar’s performance in December
December tends to generate negative returns in December more than any other month, according to its seasonality. Today we take a closer look.
Share this:

Back in early November, I outlined a bearish scenario for the US dollar given it had just formed a weekly bearish engulfing candle – and history had shown they rarely occurred in isolation. Four weeks later I’m pleased to see that it fell through the initial 104 target and came very close to 102, a target outlined in a subsequent article.
Whilst it shows the potential to bounce further from here, we note a tendency for the dollar to top around now on an intraday basis – and that Tuesday’s high stalled around a cluster of volume.
Related analysis: S&P 500 forecast: A closer look at ‘Santa’s rally’
Related analysis: S&P 500 forecast: A closer look at ‘Santa’s rally’
US dollar index technical analysis (weekly chart):
A small doji week formed around the 100-week EMA, which closed above 1.3 for a second week despite an intra-week attempt to break beneath it. If the dollar index were to close around current levels this week, it would form a three-week bullish reversal called a morning star pattern. This pattern does not provide an upside objective, although it could point towards and important swing low which markets seem happy to ignore as they relish the ‘Fed cuts in 2024 theme’.
Given the retracement from the 107.50 high nearly reached the 61.8% Fibonacci retracement level, a countertrend move does not seem unreasonable ahead of its next leg lower. However, with seasonality against the US dollar in December – we may find the upside potential is limited unless the Fed surprise with a hawkish hold next week.
US dollar index seasonality
The chart below shows basic seasonality of the US dollar over the past 52 years, using average percentage returns and win rate (the percentage of times a particular month closed higher). As this data set precedes the euro – which accounts for ~57% of its weighting, it is assumed that the data has been synthesised using the Deutschmark prior to the euro’s inception.
December stands out as the most bearish month for the US dollar, with an average return of -0.8% in December. Furthermore, it has the lowest win rate of just 34.7%, meaning it has closed higher 65.3% of the time.
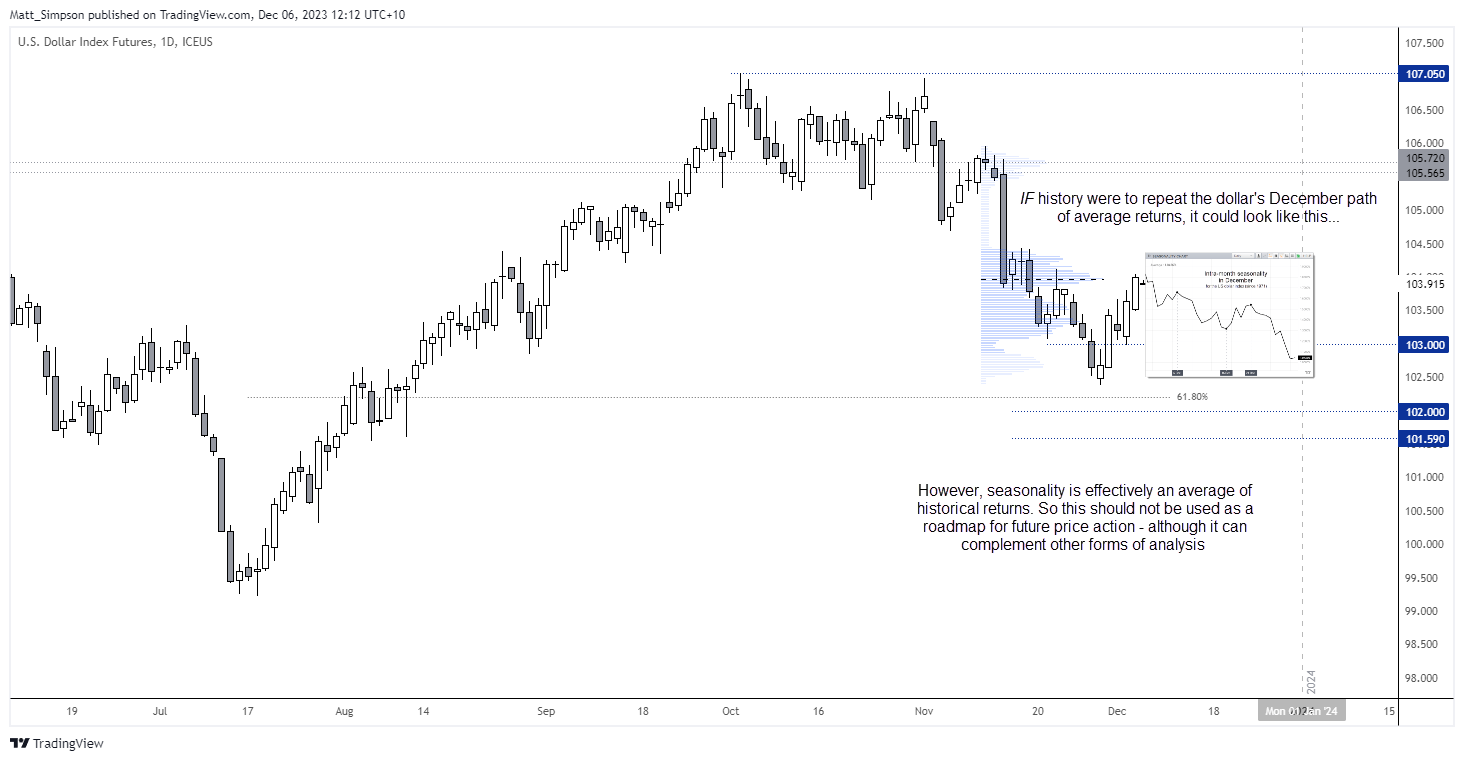
And if we look at the US dollar’s performance on a daily basis within December, there is a steady downtrend using data since 1971, with a peak on December 6th (today) and its next trough on December 16th (two days after the next FOMC meeting…) Also note that the bearish trend on December mostly ties in with the seasonal tendency for the S&P 500 to rally in the second half of December, also known as ‘Santa’s rally’.
If the intra-month seasonal pattern is to be followed this month, it suggests an interim top could form today (if not soon) for another leg lower into next week’s FOMC meeting. At which point a minor rally could then form, followed by its drop into the new year as equities presumably rally. If history were to repeat like a textbook, it could look something like this for the US dollar index.
Of course, seasonal data simply looks at the average of part performance and should not be used as a lazy path to riches. But it is interesting none the less.
US dollar index technical analysis (4hour chart):
The move higher on the US dollar index is now third wave way, although remains too soon to tell whether it is a 5-wave impulsive move higher or nearing the end of an ABC retracement. However, Tuesday’s high stalled near a HVN (high volume node), with another volume cluster forming near the monthly pivot point. And that suggests a potential high could be close.
A move to 104.50 does not seem unreasonable, but a break above it could see the rally extend due to the liquidity gap between 104.50 – 105.30. But if we see momentum turn lower beneath or around 105.50, we could assume the US dollar is tracking its seasonal pattern and seek a break beneath 103 towards 102
-- Written by Matt Simpson
Follow Matt on Twitter @cLeverEdge
How to trade with City Index
You can trade with City Index by following these four easy steps:
- Open an account, or log in if you’re already a customer
• Open an account in the UK
• Open an account in Australia
• Open an account in Singapore
- Search for the market you want to trade in our award-winning platform
- Choose your position and size, and your stop and limit levels
- Place the trade
Related tags:
Latest market news



The complete CFD trading experience
Award-winning platforms, competitive spreads, low commissions and dedicated support.
We live and breathe the markets and are dedicated to helping traders realise their ambitions as we continue to set the industry bar.
Economic calendar
Web Trader platform
Our sophisticated web-based platform is packed with features.
Related articles
EUR/USD weekly outlook: Oil, inflation and NFP in focus
After coming under significant pressure in recent weeks, the EUR/USD came off its lows to finish the week on a positive note on Friday, albeit with only a mild rebound. That was not enough to prevent the exchange rate falling for the third consecutive week, as the US dollar and bond yields rallied across the board.
Gold Q4 2026 outlook: Resilience in the face of rallying dollar and yields
As we headed towards the latter stages of Q3 and into Q4, the Fed had just hiked rates in a hawkish FOMC meeting, while the likes of the ECB and BoJ had also tightened their respective policies. Oil prices remained elevated amid the prolonged US-Iran conflict. Meanwhile, bond yields were breaking out, and the dollar was higher across the board. Yet, remarkably, gold was still holding in the positive territory for the third quarter, even if it had weakened somewhat in September.

EUR/USD Q4 2026 Outlook: Euro at a Crossroads as Fed, ECB Tighten 9 25 2026
EUR/USD enters Q4 at a pivotal inflection point as competing Fed-ECB policy paths and persistent inflation risks collide with major technical support.

StoneX Europe Ltd may make third party material available on this website which may contain information included but not limited to the conditions of financial markets. The material is for information purposes only and does not contain, and should not be construed as containing, investment advice and/or investment recommendation and/or an investment research and/or an offer of or solicitation for any transactions in financial instruments; any decision to enter into a specific transaction shall be made by the client following an assessment by him/her of their situation.
StoneX Europe Ltd makes no representation or warranty and assumes no liability as to the accuracy or completeness of the information provided, nor any loss arising from any investment based on a recommendation, forecast or other information supplied. You should always seek independent advice as to your suitability to speculate in any related markets and your ability to assume the associated risks, if you are at all unsure. We are not under any obligation to update any such material. Any opinion made may be personal to the author and may not reflect the opinion of StoneX Europe Ltd.