



US Dollar Possible Profit Taking Actions before Nonfarm Payrolls
On Tuesday, the ICE U.S. Dollar Index has stabilized after briefing dropping to its weakest level in more than two years, ending up 0.1% on day to 92.31. U.S. ADP private jobs report for August will be today's focus, with an increase of 1 million expected and compared with +167,000 in July.
Share this:

On Tuesday, the ICE U.S. Dollar Index has stabilized after briefing dropping to its weakest level in more than two years, ending up 0.1% on day to 92.31. U.S. ADP private jobs report for August will be today's focus, with an increase of 1 million expected and compared with +167,000 in July.
The closely watched non-farm payrolls report is also due on Friday, which may prompt profit taking actions by investors who hold bearish positions in the U.S. dollar.
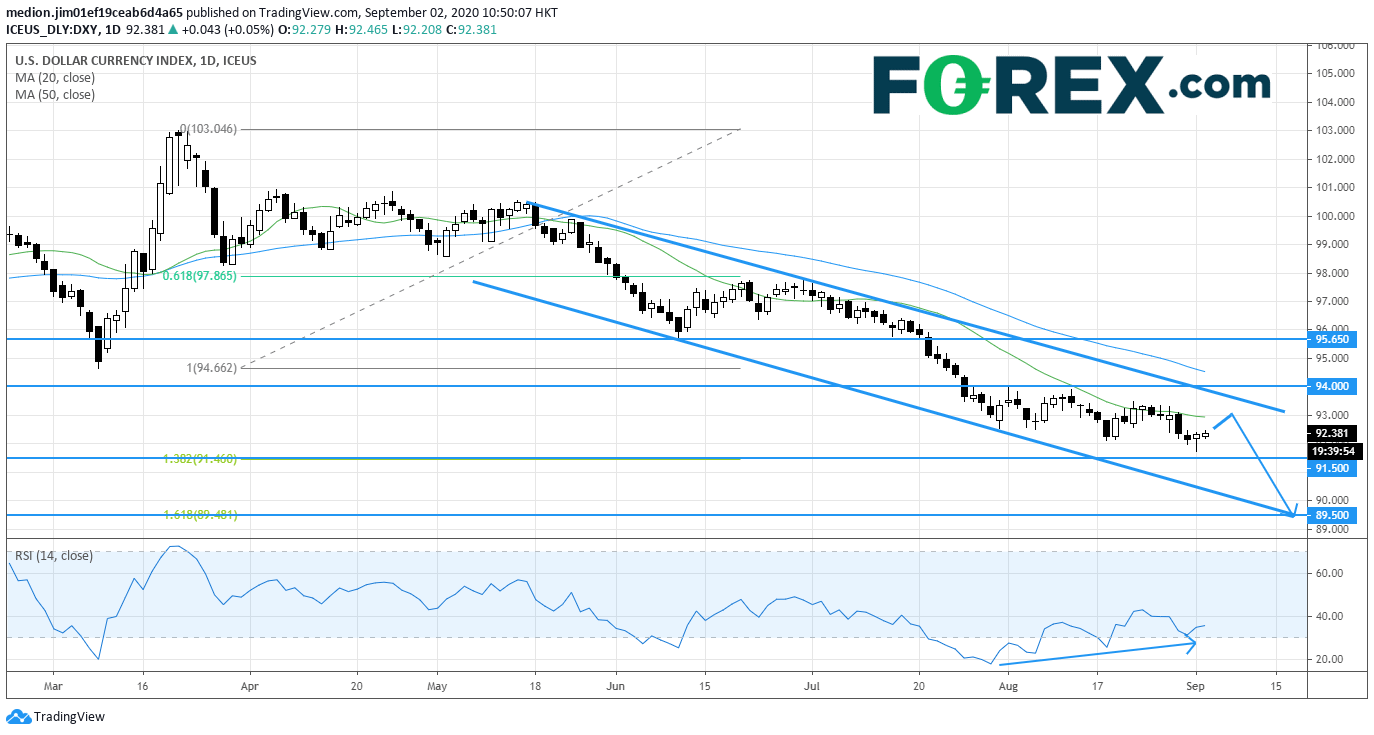
On a daily chart, although the index posted a rebound, it is trading within the bearish channel, indicating the bearish outlook. Currently, the index stays below the declining 20-day moving average.
Investor should beware that the relative strength index indicates a bullish divergence signal, suggesting the loss of downward momentum for the index.
As long as 94.00 acts as the resistance level, the index may reach the support level at 91.50 and 89.50 on the downside.

Source: GAIN Capital, TradingView
The closely watched non-farm payrolls report is also due on Friday, which may prompt profit taking actions by investors who hold bearish positions in the U.S. dollar.
On a daily chart, although the index posted a rebound, it is trading within the bearish channel, indicating the bearish outlook. Currently, the index stays below the declining 20-day moving average.
Investor should beware that the relative strength index indicates a bullish divergence signal, suggesting the loss of downward momentum for the index.
As long as 94.00 acts as the resistance level, the index may reach the support level at 91.50 and 89.50 on the downside.
Source: GAIN Capital, TradingView
On Tuesday, the ICE U.S. Dollar Index has stabilized after briefing dropping to its weakest level in more than two years, ending up 0.1% on day to 92.31. U.S. ADP private jobs report for August will be today's focus, with an increase of 1 million expected and compared with +167,000 in July.
The closely watched non-farm payrolls report is also due on Friday, which may prompt profit taking actions by investors who hold bearish positions in the U.S. dollar.
On a daily chart, although the index posted a rebound, it is trading within the bearish channel, indicating the bearish outlook. Currently, the index stays below the declining 20-day moving average.
Investor should beware that the relative strength index indicates a bullish divergence signal, suggesting the loss of downward momentum for the index.
As long as 94.00 acts as the resistance level, the index may reach the support level at 91.50 and 89.50 on the downside.
Source: GAIN Capital, TradingView
The closely watched non-farm payrolls report is also due on Friday, which may prompt profit taking actions by investors who hold bearish positions in the U.S. dollar.
On a daily chart, although the index posted a rebound, it is trading within the bearish channel, indicating the bearish outlook. Currently, the index stays below the declining 20-day moving average.
Investor should beware that the relative strength index indicates a bullish divergence signal, suggesting the loss of downward momentum for the index.
As long as 94.00 acts as the resistance level, the index may reach the support level at 91.50 and 89.50 on the downside.
Source: GAIN Capital, TradingView
Related tags:
Latest market news




The complete CFD trading experience
Award-winning platforms, competitive spreads, low commissions and dedicated support.
We live and breathe the markets and are dedicated to helping traders realise their ambitions as we continue to set the industry bar.
Economic calendar
Web Trader platform
Our sophisticated web-based platform is packed with features.
Related articles

USD/CAD shooting star puts September surge on notice
USD/CAD has printed a clear bearish reversal pattern after an extraordinary September surge, but confirmation may depend heavily on how US Treasury yields react to Friday’s payrolls report.


USD/JPY Weekly Outlook: Payrolls loom as US rates remain the dominant driver
Strong US growth and hawkish Fed pricing continue to support USD/JPY, while intervention risk appears to be kicking in at lower levels

USD/CAD Forecast: Breakdown deepens as Fed hike bets fade
USD/CAD is trading at its lowest level since early June as data divergence builds. Attention now shifts to US inflation and whether Fed rate hike bets continue to dwindle.
StoneX Europe Ltd may make third party material available on this website which may contain information included but not limited to the conditions of financial markets. The material is for information purposes only and does not contain, and should not be construed as containing, investment advice and/or investment recommendation and/or an investment research and/or an offer of or solicitation for any transactions in financial instruments; any decision to enter into a specific transaction shall be made by the client following an assessment by him/her of their situation.
StoneX Europe Ltd makes no representation or warranty and assumes no liability as to the accuracy or completeness of the information provided, nor any loss arising from any investment based on a recommendation, forecast or other information supplied. You should always seek independent advice as to your suitability to speculate in any related markets and your ability to assume the associated risks, if you are at all unsure. We are not under any obligation to update any such material. Any opinion made may be personal to the author and may not reflect the opinion of StoneX Europe Ltd.