



US Natural Gas at lowest level since August 2020
The price of Natural Gas has moved a long way in a short amount of time. But is it ready to reverse?
Share this:

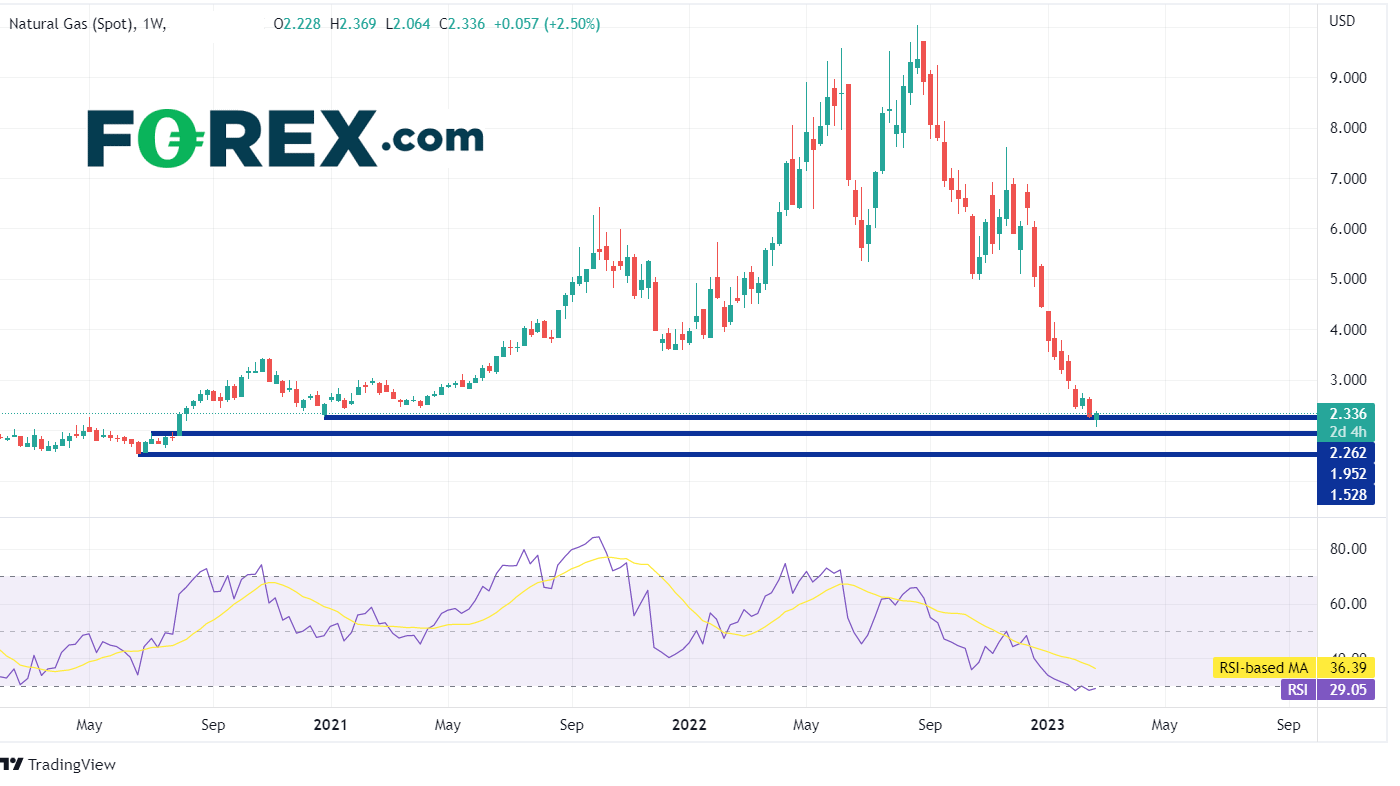
The price of Natural Gas CFDs traded to their lowest level since August 2020 as price broke through 2.262 this week. During the week of December 12th, 2022, price reached a high of 6.882. Since then, NATGAS prices have fallen dramatically, dropping nine of the last 10 weeks prior. This week’s low, thus far, is 2.064. However, if price can close at or near 2.369 for the week, the weekly candle will have formed a hammer formation, indicating the possibility of a bounce. In addition, notice that the RSI is in oversold territory at 29.05. This also indicates that price may be oversold, and a bounce is ahead. Price is approaching additional support levels from 2020. The first level is horizontal support from July 2020 at 1.952. Below there, support crosses at the lows from June 2020 at 1.5828.
Source: Tradingview, Stone X
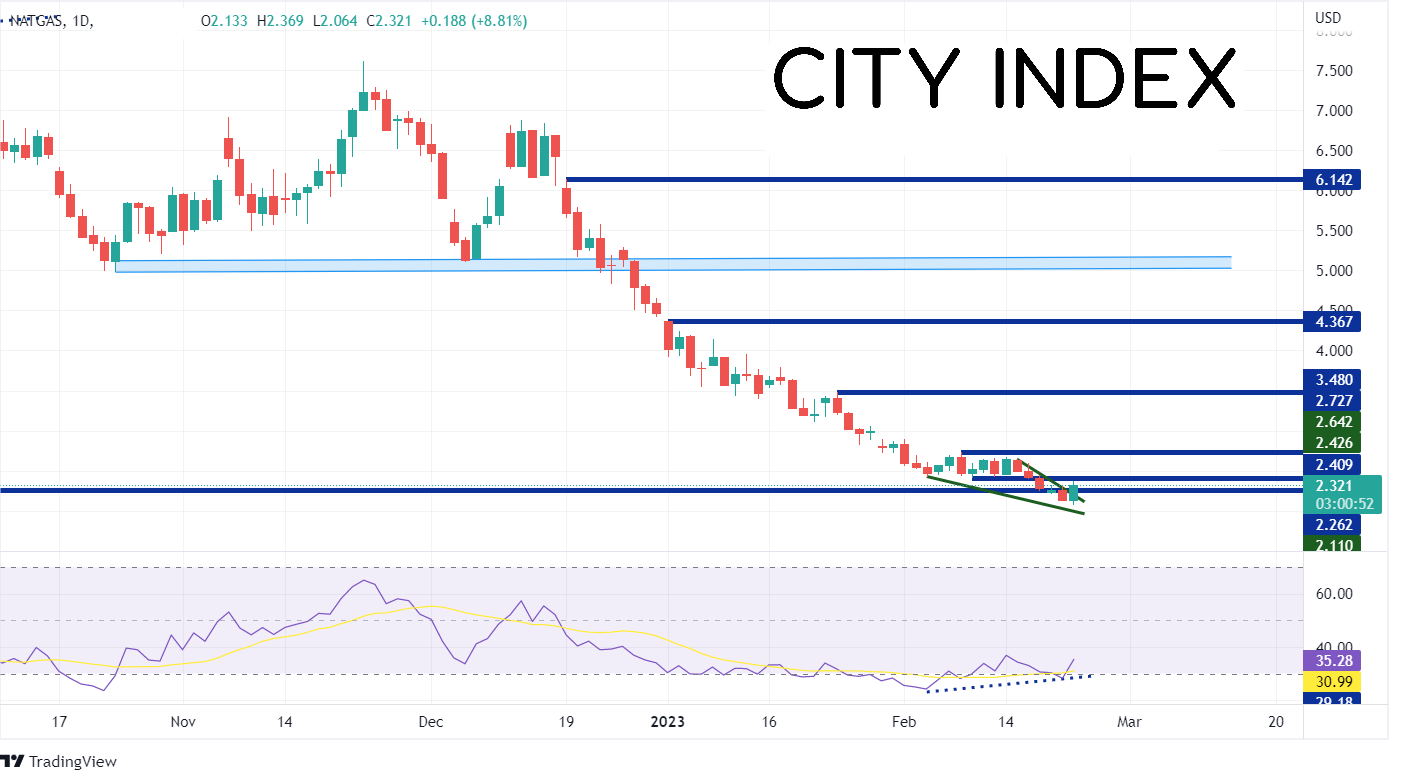
On a daily timeframe, it may be possible that a reversal has already begun. On Wednesday, the price of NATGAS formed a bullish engulfing pattern. In addition, notice the RSI on the daily timeframe is diverging with price. That is to say that the RSI is moving higher while price has still be moving lower. In addition, price has formed a descending wedge and today price broke above the top trendline of the wedge. The target for the break of a descending wedge is a 100% retracement, or 2.642. However, resistance is very near. The first level is the bottom of a series of days over the last 2 weeks near 2.426. Above there, NATGAS can move to the highs of February 8th at 2.727, then the highs of January 24th at 3.480.

Source: Tradingview, Stone X
The price of Natural Gas has moved a long way in a short amount of time. But is it ready to reverse? Some of the technical indicators look like the commodity is oversold. Perhaps a correction is ahead.
--- Written by Joe Perry, Senior Market Strategist
Follow me on Twitter at @JoeP_FOREXcom
The price of Natural Gas CFDs traded to their lowest level since August 2020 as price broke through 2.262 this week. During the week of December 12th, 2022, price reached a high of 6.882. Since then, NATGAS prices have fallen dramatically, dropping nine of the last 10 weeks prior. This week’s low, thus far, is 2.064. However, if price can close at or near 2.369 for the week, the weekly candle will have formed a hammer formation, indicating the possibility of a bounce. In addition, notice that the RSI is in oversold territory at 29.05. This also indicates that price may be oversold, and a bounce is ahead. Price is approaching additional support levels from 2020. The first level is horizontal support from July 2020 at 1.952. Below there, support crosses at the lows from June 2020 at 1.5828.

Source: Tradingview, Stone X
What is Natural Gas and how do you trade it?
On a daily timeframe, it may be possible that a reversal has already begun. On Wednesday, the price of NATGAS formed a bullish engulfing pattern. In addition, notice the RSI on the daily timeframe is diverging with price. That is to say that the RSI is moving higher while price has still be moving lower. In addition, price has formed a descending wedge and today price broke above the top trendline of the wedge. The target for the break of a descending wedge is a 100% retracement, or 2.642. However, resistance is very near. The first level is the bottom of a series of days over the last 2 weeks near 2.426. Above there, NATGAS can move to the highs of February 8th at 2.727, then the highs of January 24th at 3.480.
Source: Tradingview, Stone X
Trade Natural Gas now: Login or Open a new account!
• Open an account in the UK
• Open an account in Australia
• Open an account in Singapore
The price of Natural Gas has moved a long way in a short amount of time. But is it ready to reverse? Some of the technical indicators look like the commodity is oversold. Perhaps a correction is ahead.
Learn more about forex trading opportunities.
--- Written by Joe Perry, Senior Market Strategist
Follow me on Twitter at @JoeP_FOREXcom
Related tags:


The complete CFD trading experience
Award-winning platforms, competitive spreads, low commissions and dedicated support.
We live and breathe the markets and are dedicated to helping traders realise their ambitions as we continue to set the industry bar.
Economic calendar
Web Trader platform
Our sophisticated web-based platform is packed with features.
Related articles

NZD/USD pressure mounts as payrolls looms large
NZD/USD has fallen sharply as Fed rate expectations reset higher, but extreme downside stretch and major support raise the risk of a violent counter-trend rebound.

US Core PCE Preview: Stale or Significant for the Fed
Core PCE inflation takes center stage Wednesday, with traders watching for signs of renewed price pressure and clues on whether the Fed could hike again in October.

Australian Dollar Forecast: AUD/USD Four-Week Slide Nears Critical Uptrend Support 9 29 2026
Aussie momentum has deteriorated sharply into quarter-end, with inflation, Core PCE and NFP on tap as AUD/USD closes in on a pivotal technical threshold.

StoneX Europe Ltd may make third party material available on this website which may contain information included but not limited to the conditions of financial markets. The material is for information purposes only and does not contain, and should not be construed as containing, investment advice and/or investment recommendation and/or an investment research and/or an offer of or solicitation for any transactions in financial instruments; any decision to enter into a specific transaction shall be made by the client following an assessment by him/her of their situation.
StoneX Europe Ltd makes no representation or warranty and assumes no liability as to the accuracy or completeness of the information provided, nor any loss arising from any investment based on a recommendation, forecast or other information supplied. You should always seek independent advice as to your suitability to speculate in any related markets and your ability to assume the associated risks, if you are at all unsure. We are not under any obligation to update any such material. Any opinion made may be personal to the author and may not reflect the opinion of StoneX Europe Ltd.